轻量级智能监控平台k8s容器后部署
·
目录
本项目是一套基于 K8s 的 Linux 集群主机监控告警系统。使用 Python 采集各节点 CPU、内存、磁盘、IO 等硬件指标,数据同时输出给 Prometheus 做时序监控并存入 MySQL 留存历史。资源超出阈值会调用 DeepSeek 做 AI 故障分析,并通过企业微信 webhook 推送告警,搭配 Grafana 实现监控可视化大盘展示。
服务器配置
| 服务器序号 | 角色 | 内网 IP | 核心部署组件 | 备注 |
|---|---|---|---|---|
| 1 | 监控服务器 | 192.168.83.129 | Prometheus、Grafana、node-exporter(宿主机)、Alertmanager | 集群外部独立监控节点,不加入 K8s 集群 |
| 2 | K8s 主节点 / MySQL 节点 | 192.168.83.11 | K8s Node、MySQL Deployment、node-monitor DaemonSet、node-exporter DaemonSet | 固定调度 MySQL,本地磁盘存储数据 |
| 3 | K8s 工作节点 | 192.168.83.12 | K8s Node、node-monitor DaemonSet、node-exporter DaemonSet | 无固定业务,仅运行监控 Pod |
| 4 | K8s 工作节点 | 192.168.83.13 | K8s Node、node-monitor DaemonSet、node-exporter DaemonSet | 无固定业务,仅运行监控 Pod |
获取项目代码
git clone https://github.com/y114514-zero/Simple-system-detection-and-alerting---Linux.git
cd Simple-system-detection-and-alerting---Linux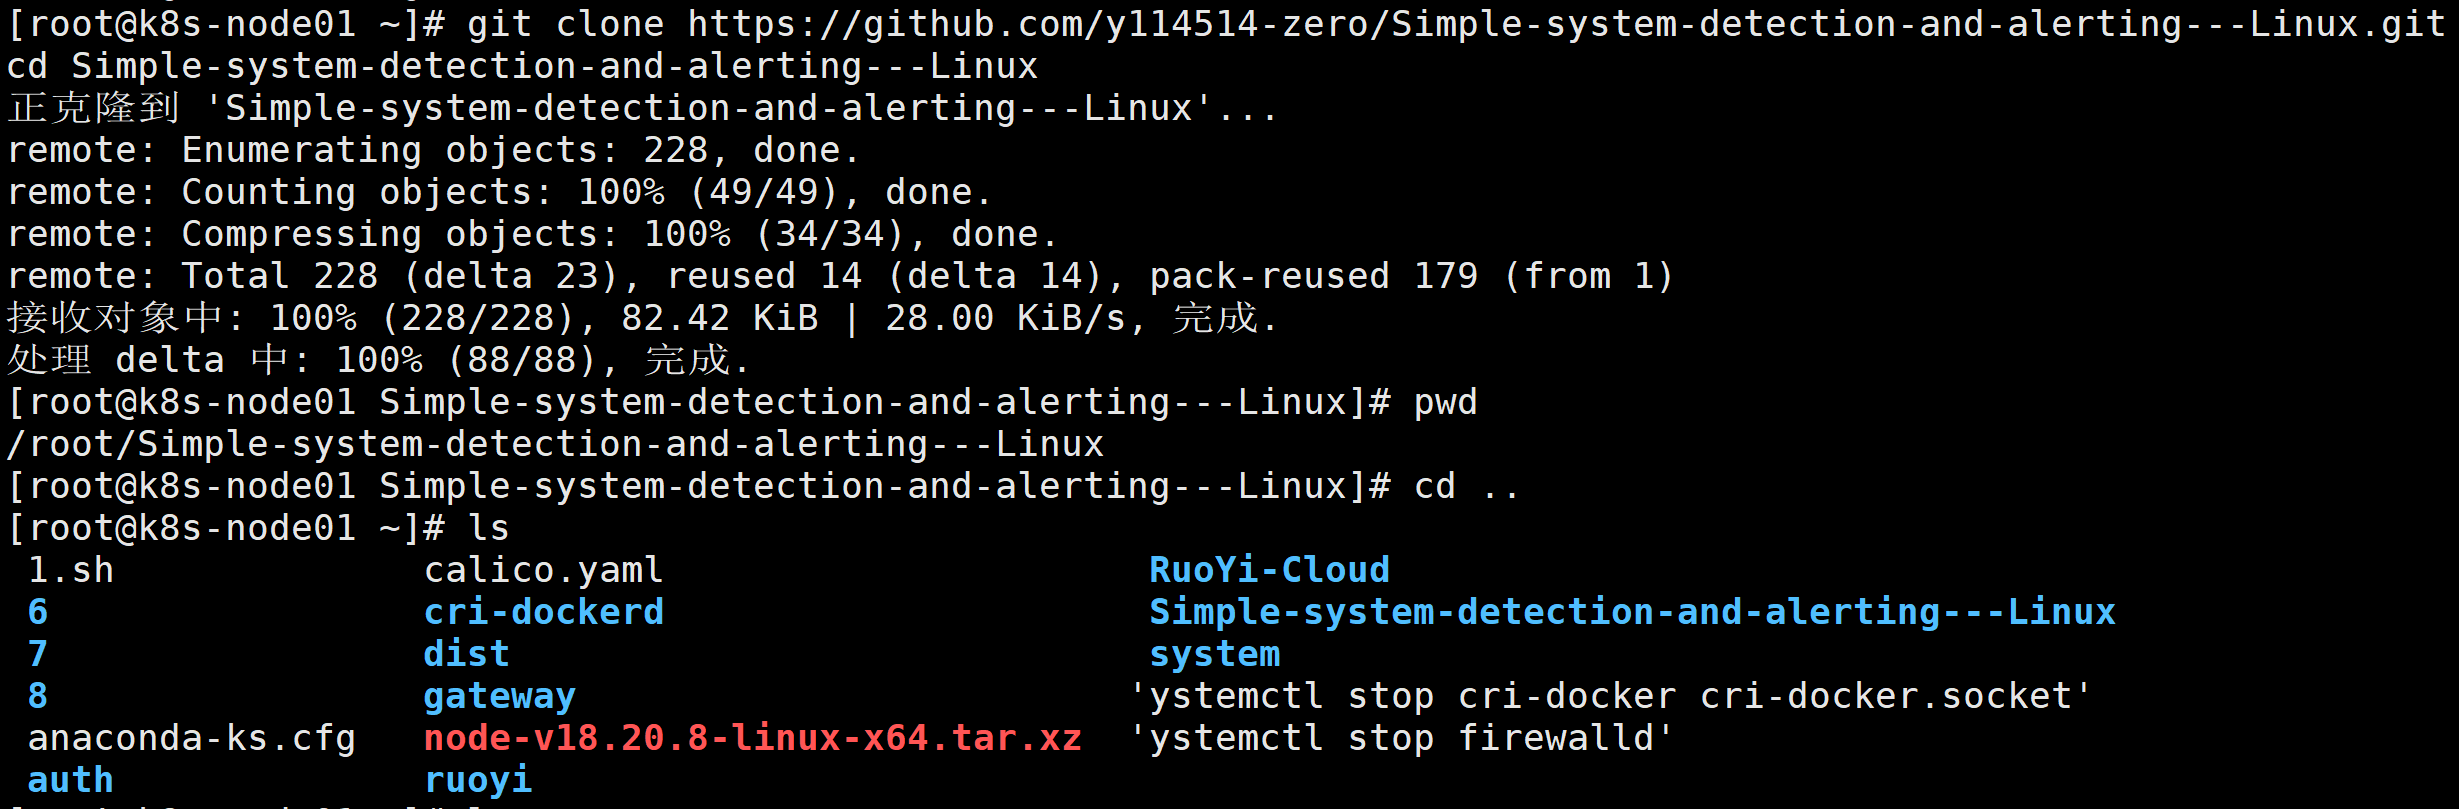
构建并推送容器镜像
编写Dockerfile
[root@k8s-node01 Simple-system-detection-and-alerting---Linux]# cat Dockerfile
FROM python:3.9-slim

# 告警日志
ENV PYTHONUNBUFFERED=1

# 设置时区
ENV TZ=Asia/Shanghai
RUN ln -snf /usr/share/zoneinfo/$TZ /etc/localtime && echo $TZ > /etc/timezone

# 安装可能需要的依赖
RUN apt-get update && apt-get install -y --no-install-recommends gcc python3-dev && rm -rf /var/lib/apt/lists/*

WORKDIR /app

# 复制依赖文件并安装
COPY requirements.txt .
RUN pip install --no-cache-dir -r requirements.txt

# 复制项目代码
COPY . .

# Prometheus 端口
EXPOSE 8000

# 直接运行主程序
CMD ["python", "monitor.py"]
构建镜像
docker build -t simple-monitor:v1 .


docker images | grep simple-monitor
测试是否构建成功
本地测试运行(验证镜像是否正常)
docker run -d --name test-monitor -p 8000:8000 simple-monitor:v1

查看日志
docker logs -f test-monitor

测试Prometheus指标端点
curl http://localhost:8000/metrics

如果测试通过,停止并删除测试容器
docker stop test-monitor && docker rm test-monitor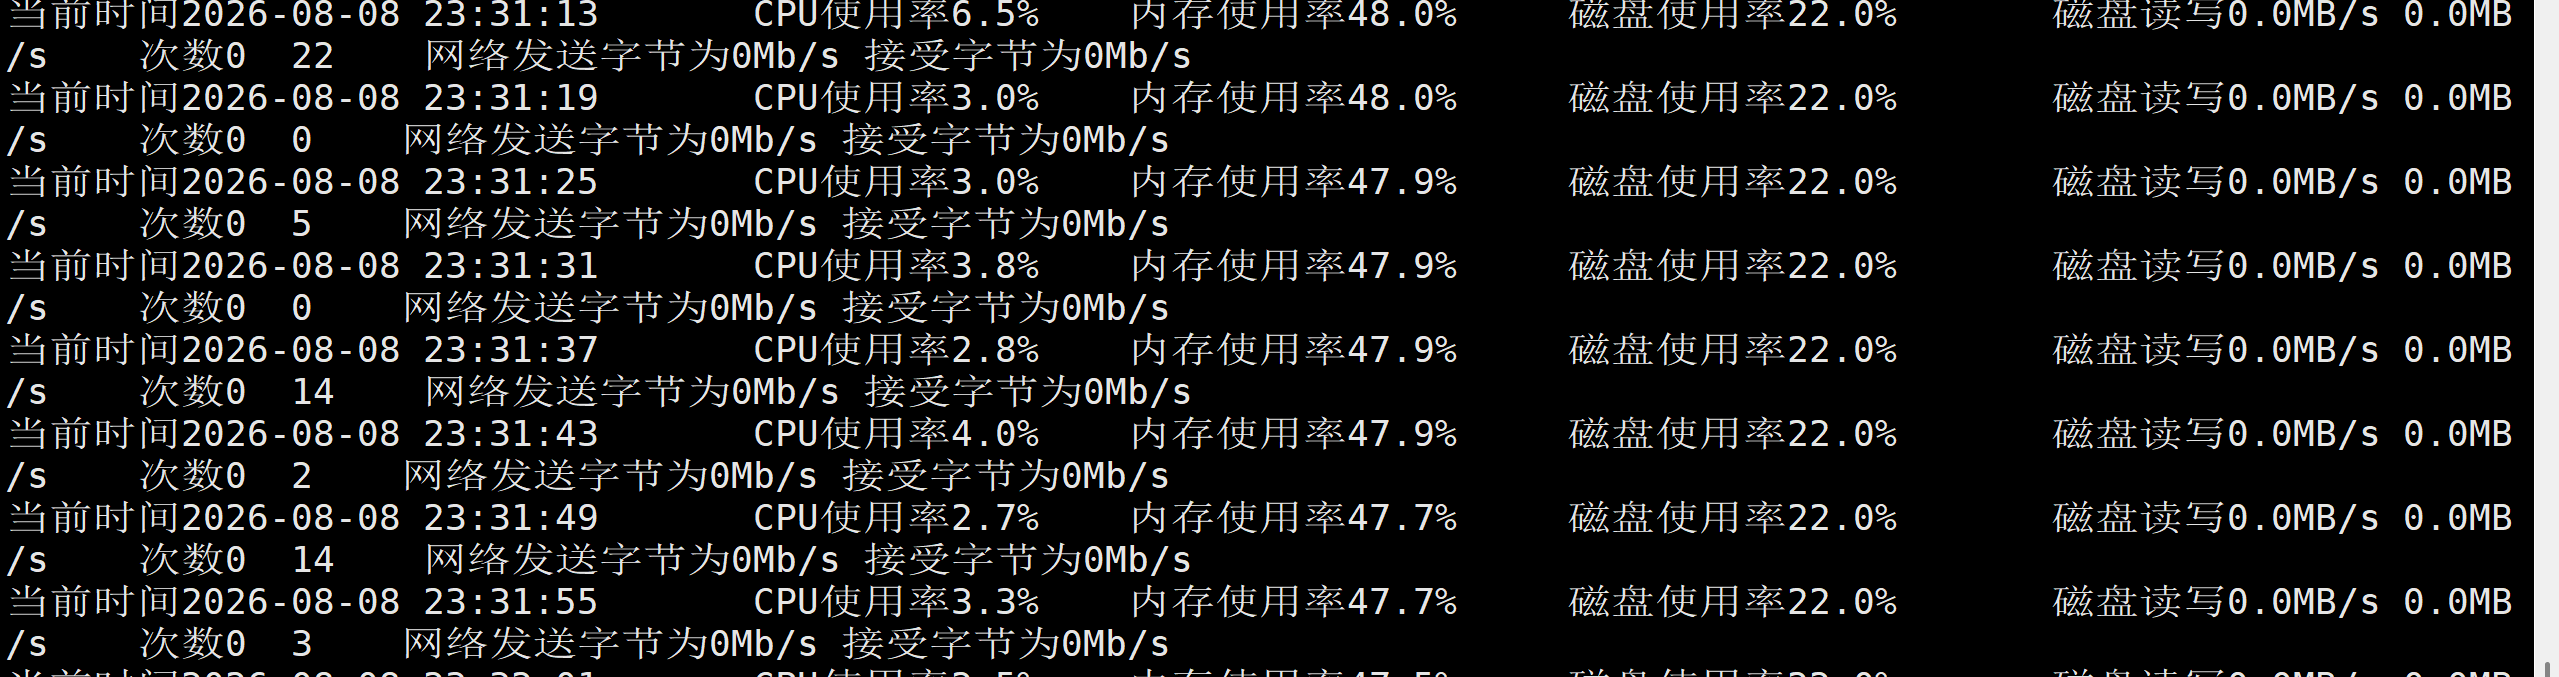
推送镜像到阿里仓库
1登录阿里云 Container Registry
docker login --username=nick2308359956 crpi-l986bg1ovxy9r4lx.cn-hongkong.personal.cr.aliyuncs.com

2docker tag simple-monitor:v1 crpi-l986bg1ovxy9r4lx.cn-hongkong.personal.cr.aliyuncs.com/nginx_laoli/monitor:v1

3docker push crpi-l986bg1ovxy9r4lx.cn-hongkong.personal.cr.aliyuncs.com/nginx_laoli/monitor:v1

编写k8s资源清单
configmap
[root@k8s-node01 k8s]# cat configmap.yaml
kind: ConfigMap
apiVersion: v1
metadata:
  name: monitor-config
  namespace: monitoring
data:
# 硬件阈值
  CPU_MAXUSE: "80"
  MEMORY_MAXUSE: "90"
  DISK_MAXUSE: "80"
# 间隔
  INTERVAL: "3"
  ALTER_INTERVAL: "5"
  DISK_PATH: "/"
  LOG_PATH: "/dev/stdout"   # 输出地址
  MYSQL_HOST: "mysql-service"      # 集群内 MySQL Service 名称,若外部则填 IP
  MYSQL_PORT: "3306"
  MYSQL_USER: "monitorer"
  MYSQL_DB: "system_monitor"
daemonset
[root@k8s-node01 k8s]# cat daemonset.yaml
apiVersion: apps/v1
kind: DaemonSet
metadata:
  name: node-monitor
  namespace: monitoring
  labels:
    app: node-monitor
spec:
  selector:
    matchLabels:
      app: node-monitor
  template:
    metadata:
      labels:
        app: node-monitor
    spec:
      hostAliases:
      - ip: "101.91.40.24"
        hostnames:
        - "qyapi.weixin.qq.com"
      - ip: "43.242.198.77"   # 替换为实际可达 IP
        hostnames:
        - "api.deepseek.com"

      containers:
      - name: monitor
        image: crpi-l986bg1ovxy9r4lx.cn-hongkong.personal.cr.aliyuncs.com/nginx_laoli/monitor:v1
        imagePullPolicy: Always
        volumeMounts:
        - name: proc
          mountPath: /host/proc
          readOnly: true
        - name: sys
          mountPath: /host/sys
          readOnly: true
        - name: rootfs
          mountPath: /host
          readOnly: true
        ports:
        - containerPort: 8000
          name: metrics
        envFrom:                          # 注入 ConfigMap 和 Secret 的环境变量
        - configMapRef:
            name: monitor-config
        - secretRef:
            name: monitor-secret
        securityContext:
          privileged: true                # 必须特权模式才能读取宿主机的 /proc 和 /sys
      volumes:
      - name: proc
        hostPath:
          path: /proc
      - name: sys
        hostPath:
          path: /sys
      - name: rootfs
        hostPath:
          path: /
      tolerations:                        # 允许调度到所有节点(包括 master,如果需要)
      - operator: Exists
mysql
提前创建/data/mysql
[root@k8s-node01 k8s]# cat mysql-deploy.yaml
apiVersion: v1
kind: Service
metadata:
  name: mysql-service
  namespace: monitoring
  labels:
    app: mysql
spec:
  selector:
    app: mysql
  ports:
  - port: 3306
    targetPort: 3306
---
apiVersion: apps/v1
kind: Deployment
metadata:
  name: mysql
  namespace: monitoring
spec:
  replicas: 1
  selector:
    matchLabels:
      app: mysql
  template:
    metadata:
      labels:
        app: mysql
    spec:
      nodeSelector:
        kubernetes.io/hostname: k8s-node01
      containers:
      - name: mysql
        image: mysql:5.7
        env:
        - name: MYSQL_ROOT_PASSWORD
          value: "root123"
        - name: MYSQL_DATABASE
          value: "system_monitor"
        - name: MYSQL_USER
          value: "monitorer"
        - name: MYSQL_PASSWORD
          value: "123456"
        ports:
        - containerPort: 3306
        volumeMounts:
        - name: mysql-storage
          mountPath: /var/lib/mysql
      volumes:
      - name: mysql-storage
        hostPath:
          path: /data/mysql
部署后要创建表
kubectl exec -it -n monitoring deployment/mysql -- mysql -uroot -proot123

USE system_monitor;
DROP TABLE IF EXISTS metrics;
CREATE TABLE metrics (
    id INT AUTO_INCREMENT PRIMARY KEY,
    timestamp DATETIME NOT NULL,
    cpu_usage DECIMAL(5,2),
    memory_usage DECIMAL(5,2),
    disk_usage DECIMAL(5,2),
    disk_read_mb DECIMAL(10,2),
    disk_write_mb DECIMAL(10,2),
    disk_read_count INT,
    disk_write_count INT,
    net_send_mb DECIMAL(10,2),
    net_resv_mb DECIMAL(10,2),
    INDEX idx_timestamp (timestamp)
);
exit;
service
[root@k8s-node01 k8s]# cat service.yaml
apiVersion: v1
kind: Service
metadata:
  name: node-monitor
  namespace: monitoring
  labels:
    app: node-monitor
spec:
  selector:
    app: node-monitor
  ports:
  - port: 8000
    name: metrics
    targetPort: 8000
  clusterIP: None
    # If you set the `spec.type` field to `NodePort` and you want a specific port number,
    # you can specify a value in the `spec.ports[*].nodePort` field.
ns和secret
[root@k8s-node01 k8s]# cat namespace.yaml
apiVersion: v1
kind: Namespace
metadata:
  name: monitoring
[root@k8s-node01 k8s]# cat secret.yaml
apiVersion: v1
kind: Secret
metadata:
  name: monitor-secret
  namespace: monitoring
type: Opaque
stringData:
  MYSQL_PASSWORD: "123456"
  URL: "https://qyapi.weixin.qq.com/cgi-bin/webhook/send?key=136dd1c2-d2d9-4f52-xxxxxe41597"   #你的企业微信wehook地址
  API_KEY: "sk-623fcxxxxx7a6"    @deepseek密钥
  API_URL: "https://api.deepseek.com/v1"   # 可选
  MODEL_NAME: "deepseek-v4-pro"          # 可选
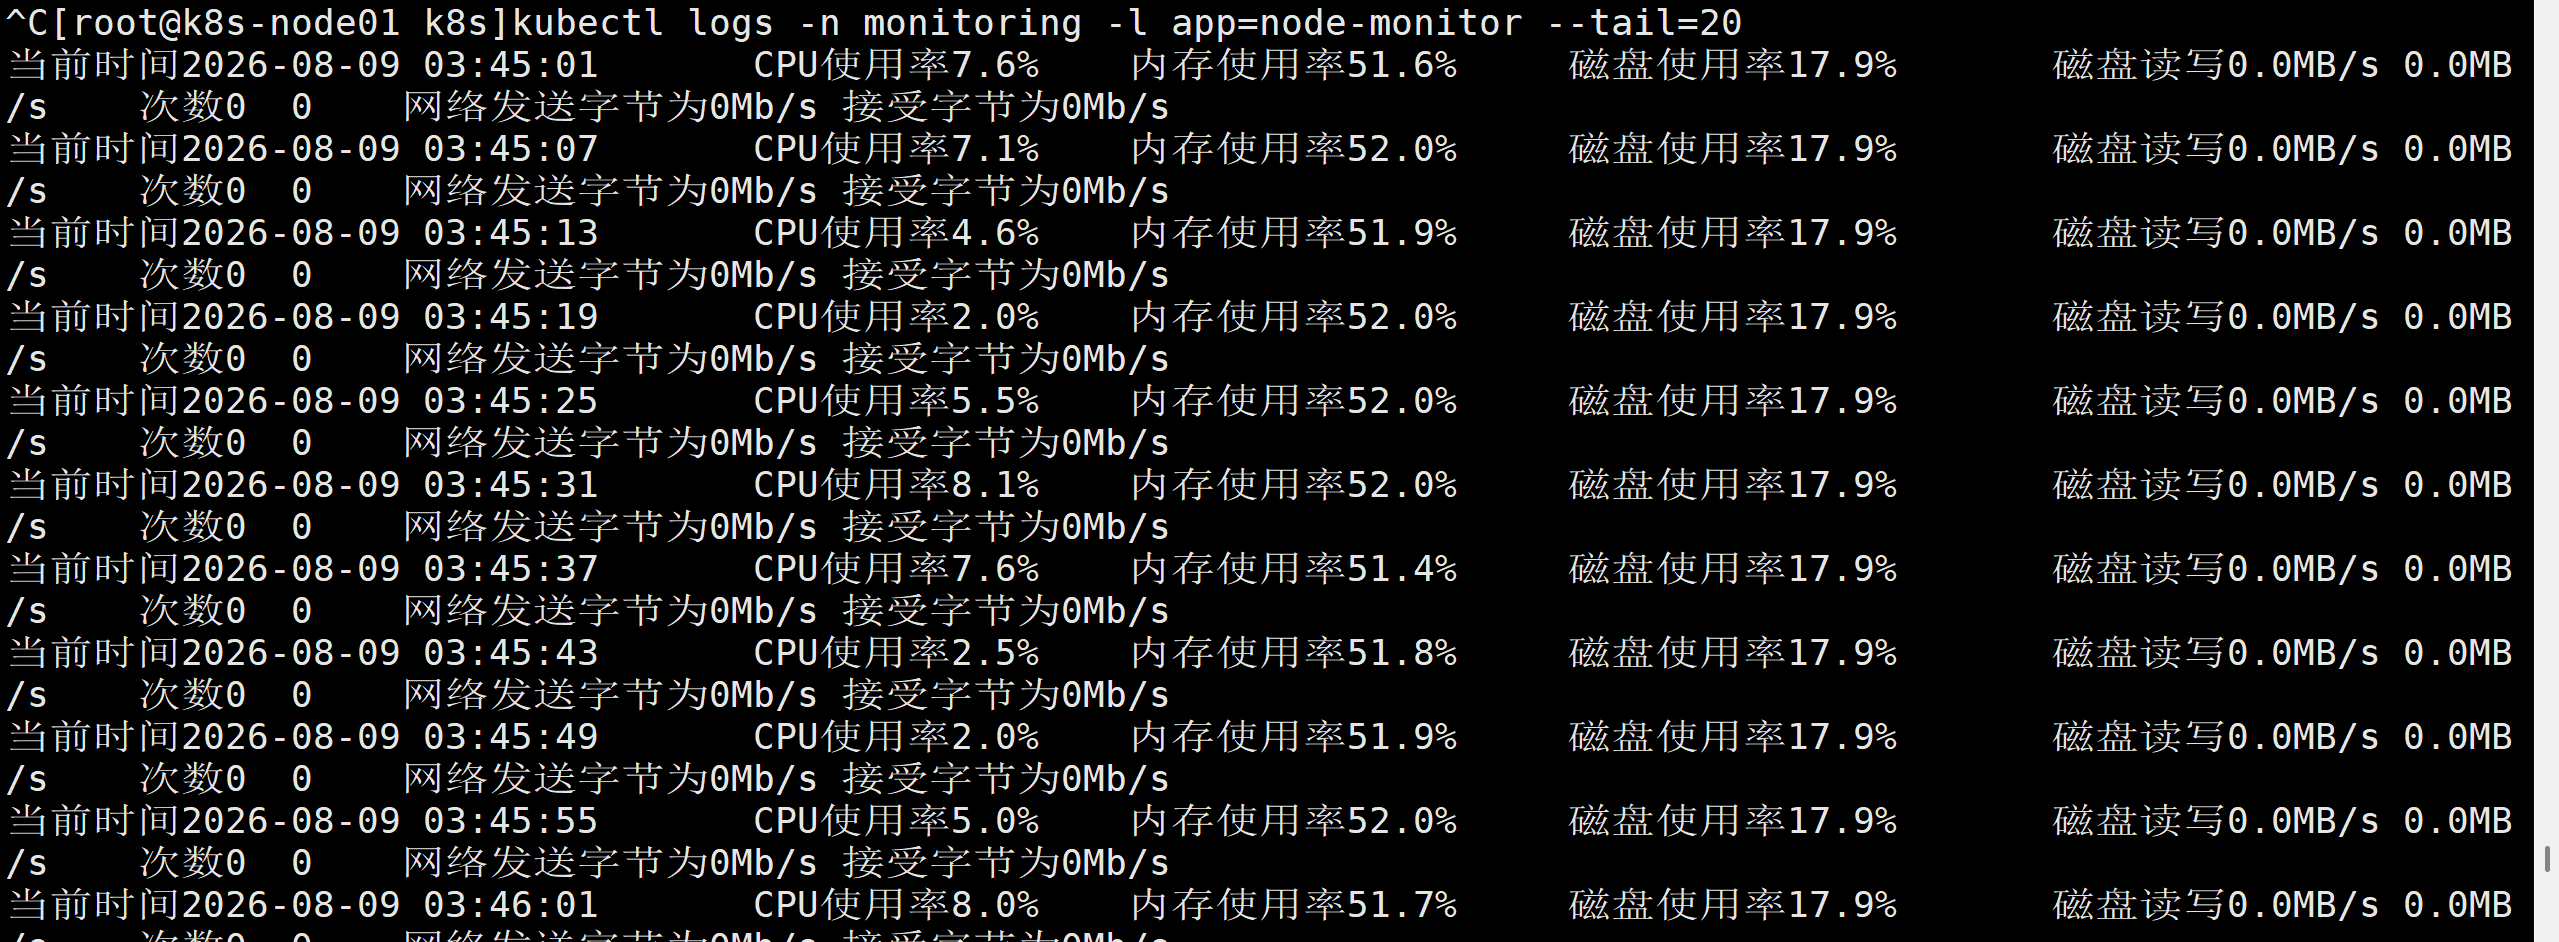
检查是否部署成功

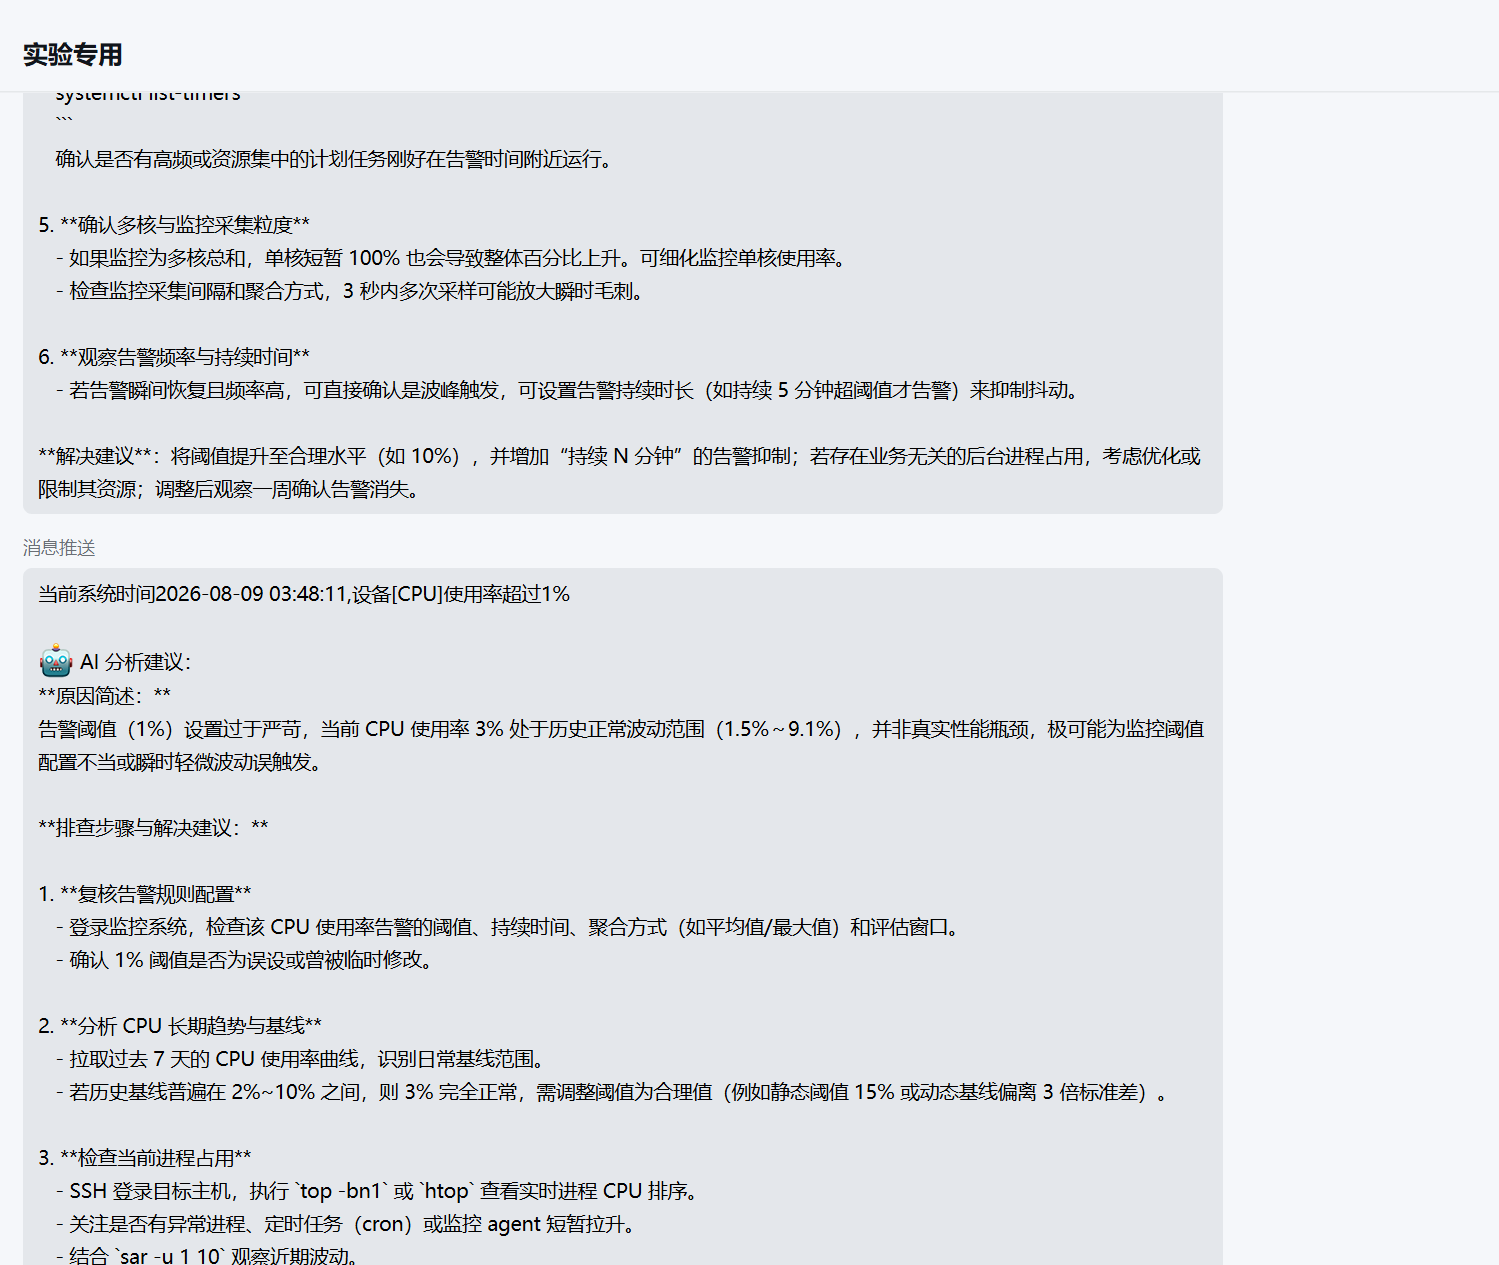
把阈值设定为1,测试ai分析功能
Prometheus+grafana实现监控数据可视化
修改Prometheus.yaml
[root@localhost prometheus]# cat prometheus.yml
# my global config
global:
  scrape_interval: 15s # Set the scrape interval to every 15 seconds. Default is every 1 minute.
  evaluation_interval: 15s # Evaluate rules every 15 seconds. The default is every 1 minute.
  # scrape_timeout is set to the global default (10s).

# Alertmanager configuration
alerting:
  alertmanagers:
    - static_configs:
        - targets:
          - localhost:9093

# Load rules once and periodically evaluate them according to the global 'evaluation_interval'.
rule_files:
  - "alert.yml"
  # - "first_rules.yml"
  # - "second_rules.yml"

# A scrape configuration containing exactly one endpoint to scrape:
# Here it's Prometheus itself.
scrape_configs:
  # The job name is added as a label `job=<job_name>` to any timeseries scraped from this config.
  - job_name: "prometheus"

    # metrics_path defaults to '/metrics'
    # scheme defaults to 'http'.

    static_configs:
      - targets: ["localhost:9090"]
       # The label name is added as a label `label_name=<label_value>` to any timeseries scraped from this config.
        labels:
          app: "prometheus"
# node-exporter配置
  - job_name: 'node-exporter'
    scrape_interval: 15s
    static_configs:
    - targets:
      - 'localhost:9100'          # prometheus本机
      - '192.168.83.11:9100'       # k8s node01
      - '192.168.83.12:9100'       # k8s node02
      - '192.168.83.13:9100'       # k8s node03
重启普罗米修斯
部署node-exporter的pod
[root@k8s-node01 k8s]# cat node-exporter-de.yaml
apiVersion: apps/v1
kind: DaemonSet
metadata:
  name: node-exporter
  namespace: monitoring
spec:
  selector:
    matchLabels:
      app: node-exporter
  template:
    metadata:
      labels:
        app: node-exporter
    spec:
      hostNetwork: true
      tolerations:
      - operator: Exists
      containers:
      - name: node-exporter
        image: quay.io/prometheus/node-exporter:v1.8.2
        ports:
        - containerPort: 9100
          hostPort: 9100
        resources:
          limits:
            cpu: 100m
            memory: 128Mi
          requests:
            cpu: 50m
            memory: 64Mi
        volumeMounts:
        - name: proc
          mountPath: /host/proc
        - name: sys
          mountPath: /host/sys
      volumes:
      - name: proc
        hostPath:
          path: /proc
      - name: sys
        hostPath:
          path: /sys

部署成功,进入grafana
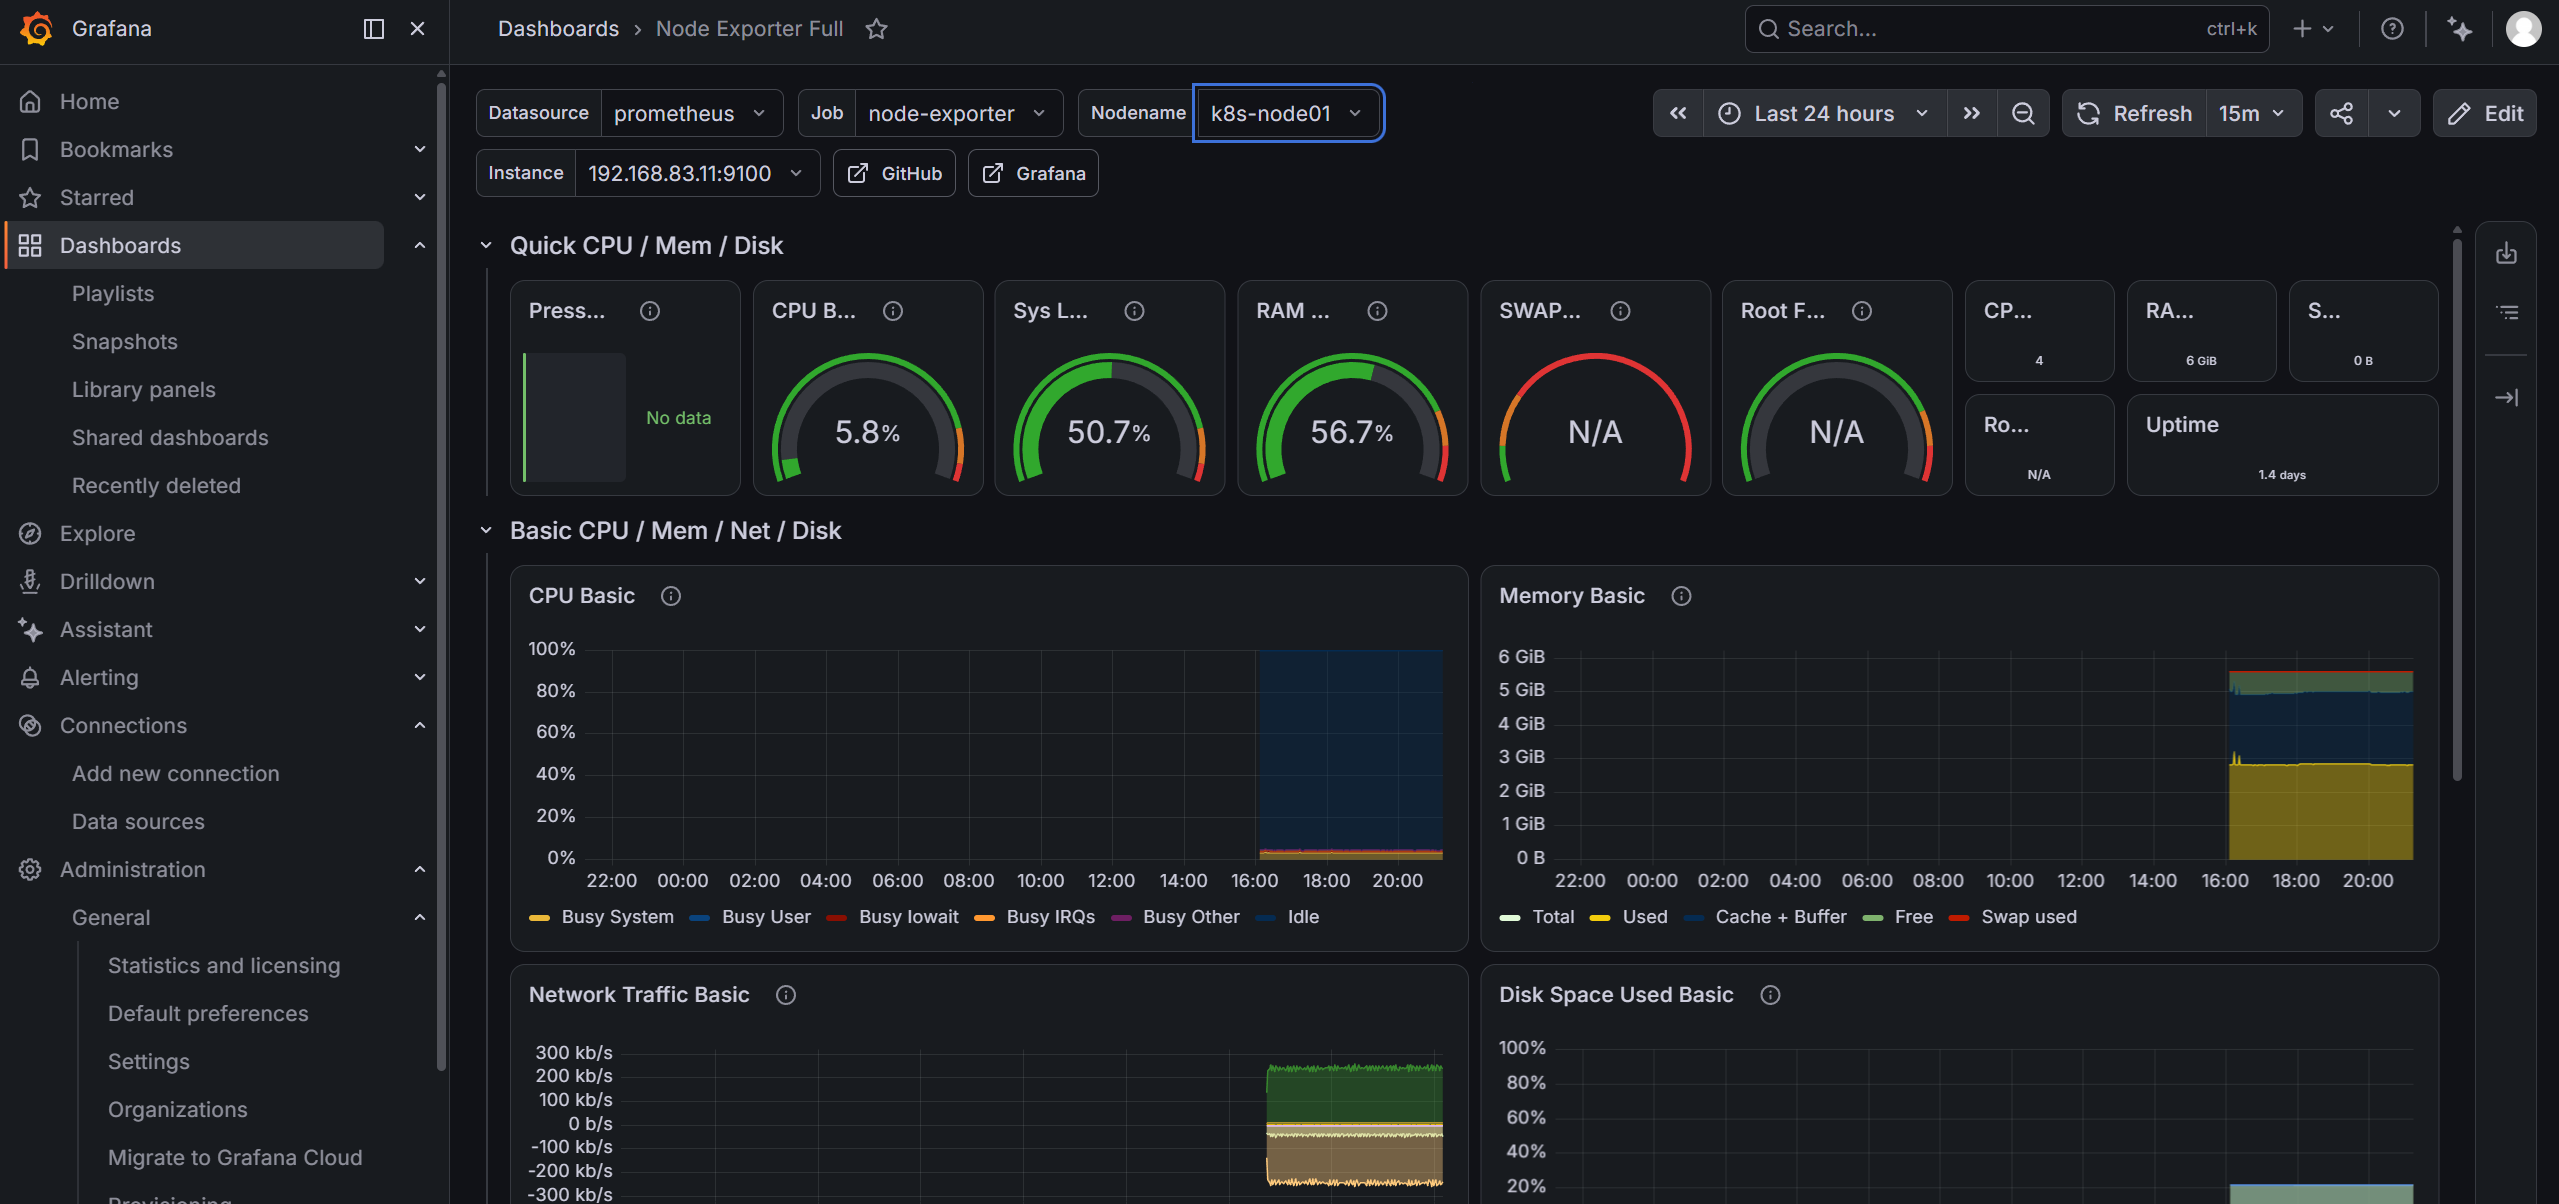
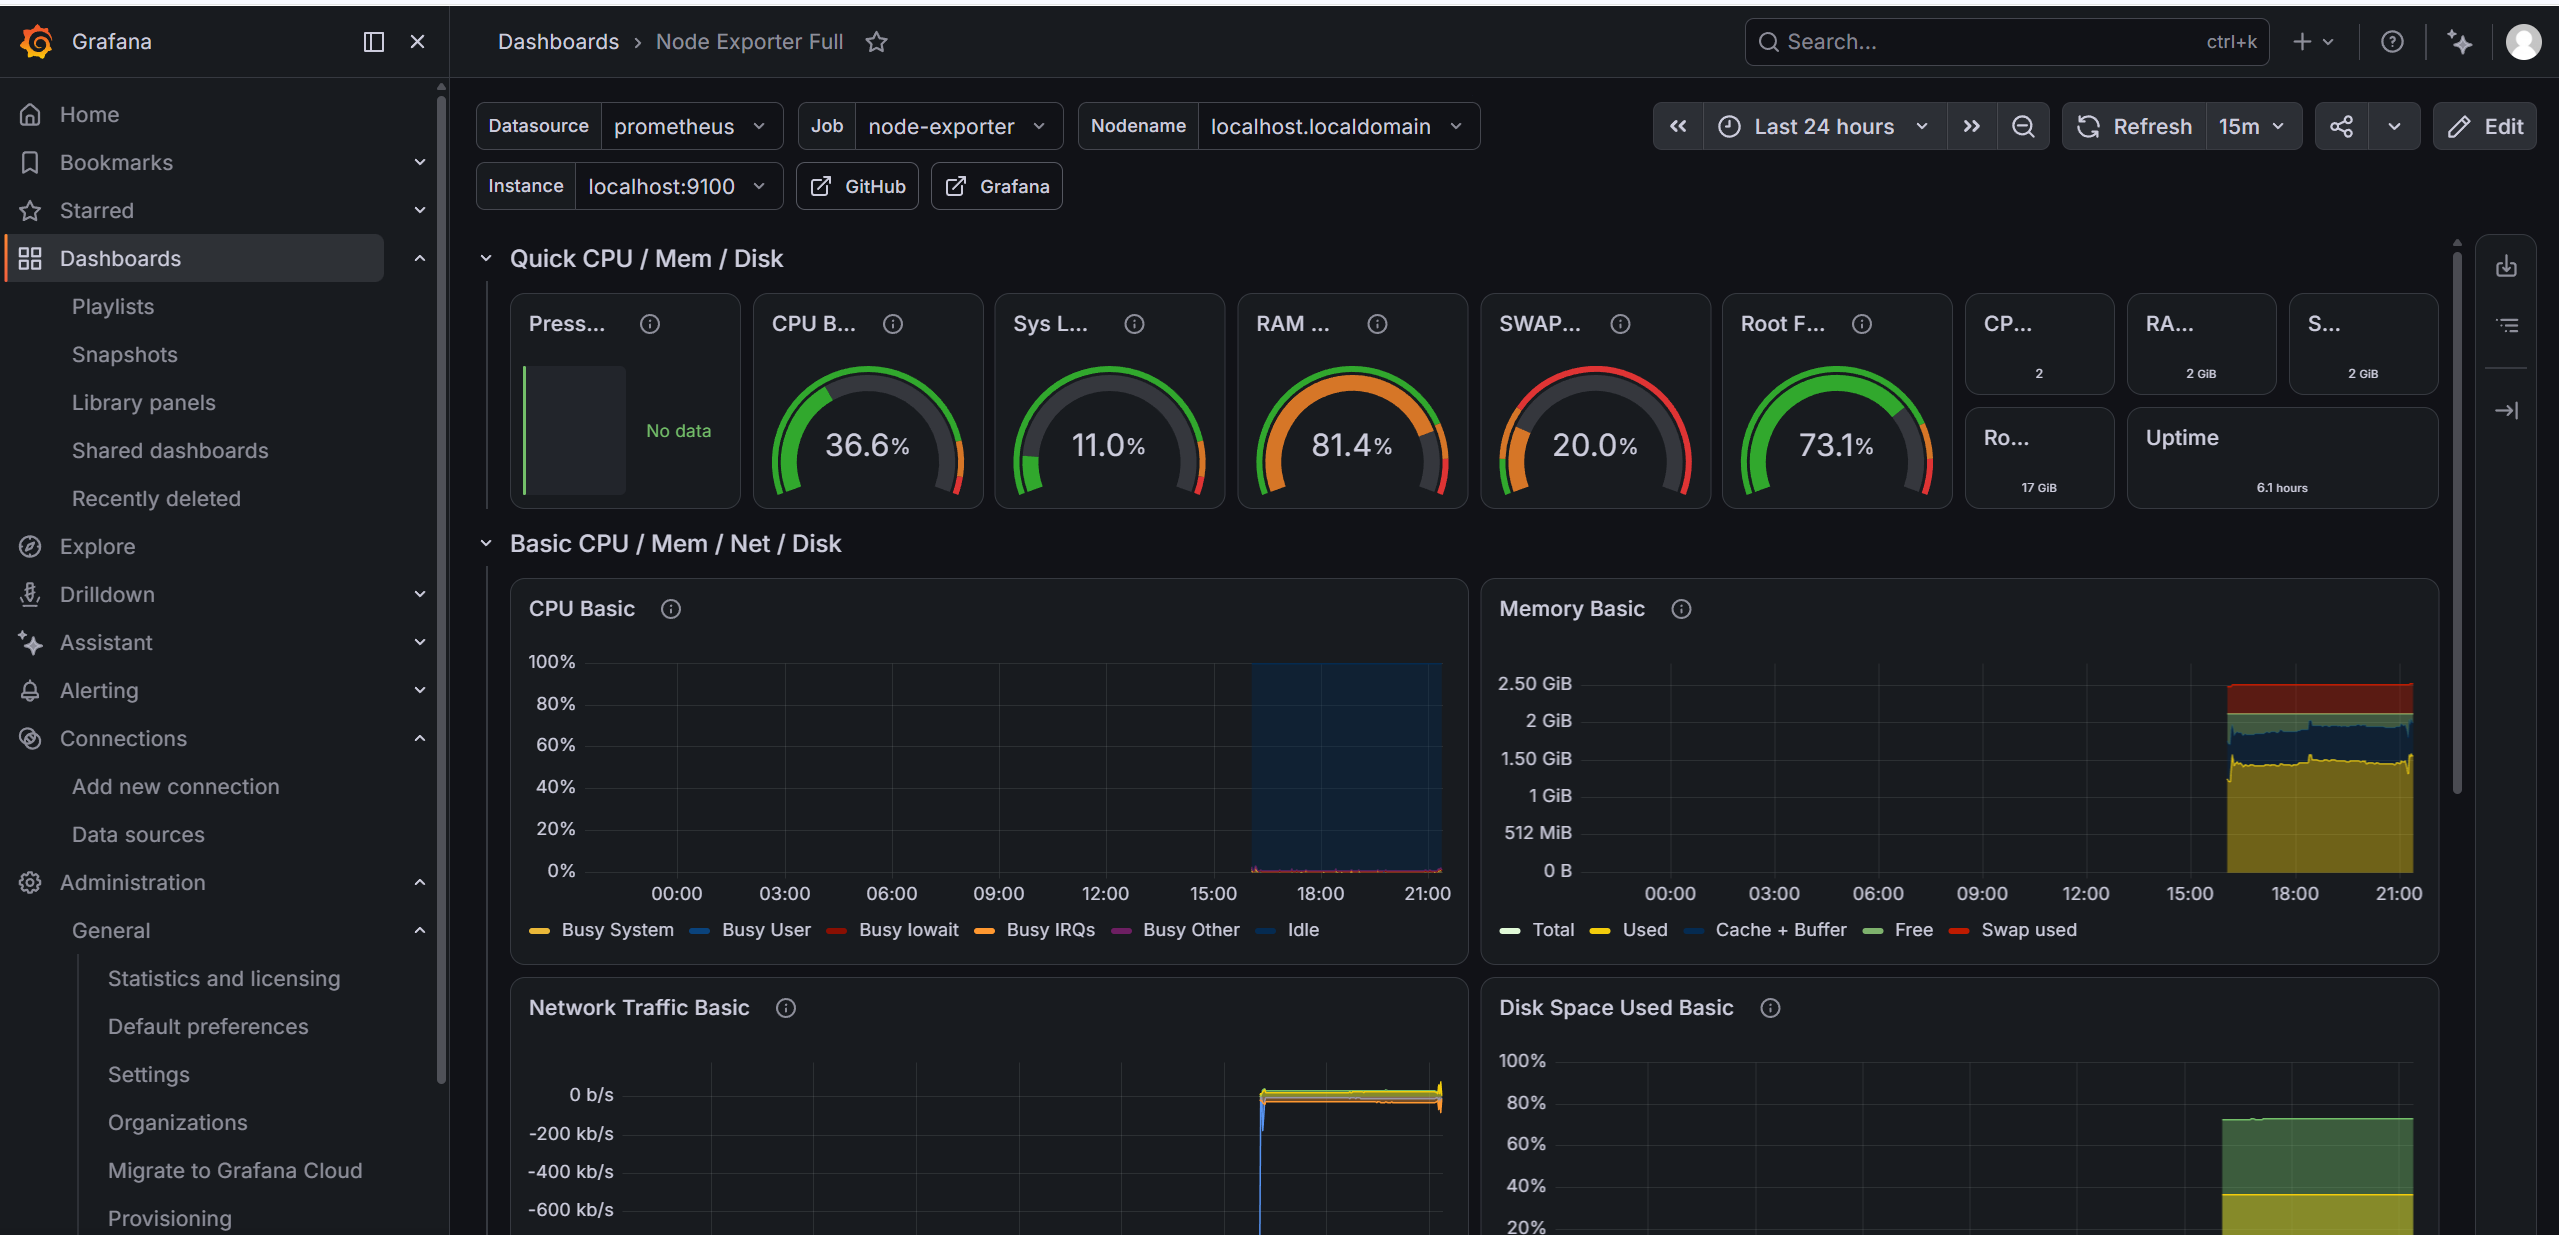
小结:
1:mysql最初使用localpath,换节点可能导致数据丢失,设置固定调度到node1
2:没有提前创建mysql文件夹,导致mysqlpod一直启动失败
3:mysql创建的表结构不对,导致daemon po写入数据时一直失败,导致循环重启

欢迎加入DeepSeek 技术社区。在这里,你可以找到志同道合的朋友,共同探索AI技术的奥秘。
更多推荐

 7
7 0
0- 0


 已为社区贡献1条内容

所有评论(0)