使用ollama完成股票技术指标的评价
本篇文章有几个有意思的点:1.使用streamlit可视化。2.计算滚动平均值和动量等指标来了解市场趋势。3.使用Llama 3对数据做解释。这段代码定义了一些全局变量,用于存储滚动数据和跟踪每日的市场情况。rolling_window和dow_rolling_window用于存储苹果公司和道琼斯指数的滚动数据。然后定义了几个变量来跟踪每日的市场情况。daily_high和 daily_low分别
本篇文章有几个有意思的点:
-
1.使用streamlit可视化。
-
2.计算滚动平均值和动量等指标来了解市场趋势。
-
3.使用Llama 3对数据做解释。
提前安装并导入如下包:
import yfinance as yf``import pandas as pd``import schedule``import time``import ollama``from datetime import datetime, timedelta
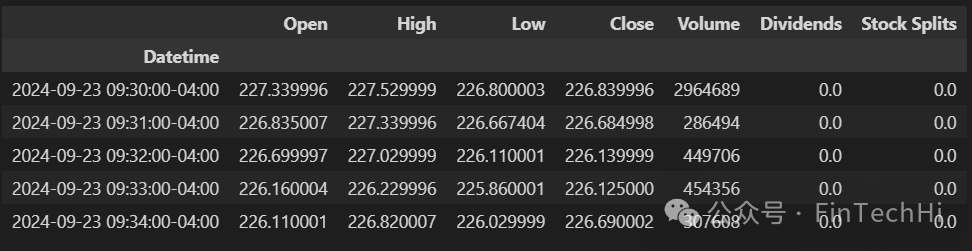
# Fetching historical data for Apple (AAPL) and Dow Jones (DJI) for yesterday (1-minute intervals)``
stock = yf.Ticker("AAPL")``dow_jones = yf.Ticker("^DJI")``data = stock.history(period="1d", interval="1m")``dow_data = dow_jones.history(period="1d", interval="1m")``data.head()
Global variables to store rolling data for analysis
``rolling_window = pd.DataFrame()``dow_rolling_window = pd.DataFrame()``# Variables to track daily context``daily_high = float('-inf')``daily_low = float('inf')``buying_momentum = 0``selling_momentum = 0
这段代码定义了一些全局变量,用于存储滚动数据和跟踪每日的市场情况。
-
rolling_window和dow_rolling_window用于存储苹果公司和道琼斯指数的滚动数据。然后定义了几个变量来跟踪每日的市场情况。
-
daily_high和 daily_low分别初始化为负无穷大和正无穷大,用于记录当天的最高价和最低价。通过将它们初始化为极端值,可以确保在实际数据更新时,这些变量会被正确地设置为当天的实际最高价和最低价。
-
buying_momentum和selling_momentum变量初始化为0,用于跟踪当天的买入和卖出动量。这些变量可以帮助分析市场情绪和趋势,判断市场是处于买入还是卖出状态。
``get_market_open_duration:Extract current time from the last element of the window
def get_market_open_duration(window):` `# Extract current time from the last element of the window` `current_time = window.index[-1].time() # Returns a datetime.time object` `# Get the previous trading day's date` `previous_trading_day = datetime.today() - timedelta(days=1)` `# Combine the previous trading day with the current time` `current_datetime = datetime.combine(previous_trading_day, current_time)` `# Define the market opening time as 09:30:00 on the previous trading day` `market_start_time = datetime.combine(previous_trading_day, datetime.strptime("09:30:00", "%H:%M:%S").time())` `# Calculate the duration the market has been open in minutes` `market_open_duration = (current_datetime - market_start_time).total_seconds() / 60 # in minutes` `return market_open_duration
get_natural_language_insights:generate natural language insights using Ollama(******重点这里,可以换成其他模型。)``
``def get_natural_language_insights(` `rolling_avg, ema, rsi, bollinger_upper, bollinger_lower,` `price_change, volume_change, dow_rolling_avg, market_open_duration, dow_price_change, dow_volume_change, daily_high, daily_low, buying_momentum, selling_momentum``):` `prompt = f"""` `You are a professional stock broker. Apple's stock has a 5-minute rolling average of {rolling_avg:.2f}.` `The Exponential Moving Average (EMA) is {ema:.2f}, and the Relative Strength Index (RSI) is {rsi:.2f}.` `The Bollinger Bands are set with an upper band of {bollinger_upper:.2f} and a lower band of {bollinger_lower:.2f}.` `The price has changed by {price_change:.2f}, and the volume has shifted by {volume_change}.` `The DOW price has changed by {dow_price_change:.2f}, and the volume has shifted by {dow_volume_change}.` `Meanwhile, the Dow Jones index has a 5-minute rolling average of {dow_rolling_avg:.2f}.` `The market has been open for {market_open_duration:.2f} minutes.` `Today's high was {daily_high:.2f} and low was {daily_low:.2f}.` `The buying momentum is {buying_momentum:.2f} and selling momentum is {selling_momentum:.2f}.` `Based on this data, provide insights into the current stock trend and the general market sentiment.` `The insights should not be longer than 100 words and should not have an introduction.` `"""` `response = ollama.chat(` `model="llama3",` `messages=[{"role": "user", "content": prompt}]` `)` `response_text = response['message']['content'].strip()` `# Print the natural language insight` `print("Natural Language Insight:", response_text)
calculate_insights:moving averages and trends
``def calculate_insights(window, dow_window):` `if len(window) >= 5:` `# Calculate 5-minute rolling average of the 'Close' prices` `rolling_avg = window['Close'].rolling(window=5).mean().iloc[-1]` `# Calculate price change and volume change` `price_change = window['Close'].iloc[-1] - window['Close'].iloc[-2] if len(window) >= 2 else 0` `volume_change = window['Volume'].iloc[-1] - window['Volume'].iloc[-2] if len(window) >= 2 else 0` `# Calculate DOW price change and volume change` `dow_price_change = dow_window['Close'].iloc[-1] - dow_window['Close'].iloc[-2] if len(dow_window) >= 2 else 0` `dow_volume_change = dow_window['Volume'].iloc[-1] - dow_window['Volume'].iloc[-2] if len(dow_window) >= 2 else 0` `# Calculate Exponential Moving Average (EMA) and Bollinger Bands (with a 5-period window)` `ema = window['Close'].ewm(span=5, adjust=False).mean().iloc[-1]` `std = window['Close'].rolling(window=5).std().iloc[-1]` `bollinger_upper = rolling_avg + (2 * std)` `bollinger_lower = rolling_avg - (2 * std)` `# Calculate Relative Strength Index (RSI) if there are enough periods (14 is typical)` `delta = window['Close'].diff()` `gain = delta.where(delta > 0, 0)` `loss = -delta.where(delta < 0, 0)` `avg_gain = gain.rolling(window=14, min_periods=1).mean().iloc[-1]` `avg_loss = loss.rolling(window=14, min_periods=1).mean().iloc[-1]` `rs = avg_gain / avg_loss if avg_loss != 0 else float('nan')` `rsi = 100 - (100 / (1 + rs))` `# Calculate Dow Jones index rolling average` `dow_rolling_avg = dow_window['Close'].rolling(window=5).mean().iloc[-1]` `market_open_duration = get_market_open_duration(window)` `# Print the calculated insights` `print(f"5-minute Rolling Average: {rolling_avg:.2f}")` `print(f"EMA: {ema:.2f}")` `print(f"RSI: {rsi:.2f}")` `print(f"Bollinger Upper Band: {bollinger_upper:.2f}, Lower Band: {bollinger_lower:.2f}")` `print(f"Price Change: {price_change:.2f}")` `print(f"Volume Change: {volume_change}")` `print(f"DOW Price Change: {dow_price_change:.2f}")` `print(f"DOW Volume Change: {dow_volume_change}")` `print(f"Dow Jones 5-minute Rolling Average: {dow_rolling_avg:.2f}")` `print(f"Daily High: {daily_high:.2f}, Daily Low: {daily_low:.2f}")` `print(f"Buying Momentum: {buying_momentum:.2f}, Selling Momentum: {selling_momentum:.2f}")` `print(f"Market has been open for {market_open_duration:.2f} minutes")` `if int(market_open_duration) % 5 == 0: # Trigger LLM every 5 minutes` `get_natural_language_insights(` `rolling_avg, ema, rsi, bollinger_upper, bollinger_lower,` `price_change, volume_change, dow_rolling_avg, market_open_duration, dow_price_change, dow_volume_change, daily_high, daily_low, buying_momentum, selling_momentum` `)
process_stock_update:process a new stock update every minute
``def process_stock_update():` `global rolling_window, data, dow_rolling_window, dow_data` `global daily_high, daily_low, buying_momentum, selling_momentum` `if not data.empty and not dow_data.empty:` `# Simulate receiving a new data point for AAPL and Dow Jones` `update = data.iloc[0].to_frame().T` `time_str = update.index[0].time()` `print(time_str) # Output: ['09:30:00']` `dow_update = dow_data.iloc[0].to_frame().T` `data = data.iloc[1:] # Safely remove the first row without causing index issues` `dow_data = dow_data.iloc[1:]` `# Append the new data points to the rolling windows` `rolling_window = pd.concat([rolling_window, update], ignore_index=False)` `dow_rolling_window = pd.concat([dow_rolling_window, dow_update], ignore_index=False)` `# Update daily high and low` `daily_high = max(daily_high, update['Close'].values[0])` `daily_low = min(daily_low, update['Close'].values[0])` `# Calculate momentum based on price changes` `if len(rolling_window) >= 2:` `price_change = update['Close'].values[0] - rolling_window['Close'].iloc[-2]` `if price_change > 0:` `buying_momentum += price_change` `else:` `selling_momentum += abs(price_change)` `# Limit the rolling window to 5 minutes for moving average` `if len(rolling_window) > 5:` `rolling_window = rolling_window.iloc[1:]` `if len(dow_rolling_window) > 5:` `dow_rolling_window = dow_rolling_window.iloc[1:]` `# Calculate insights (moving averages, Bollinger Bands, RSI, etc.)` `calculate_insights(rolling_window, dow_rolling_window)
Schedule job to simulate receiving updates every minute:
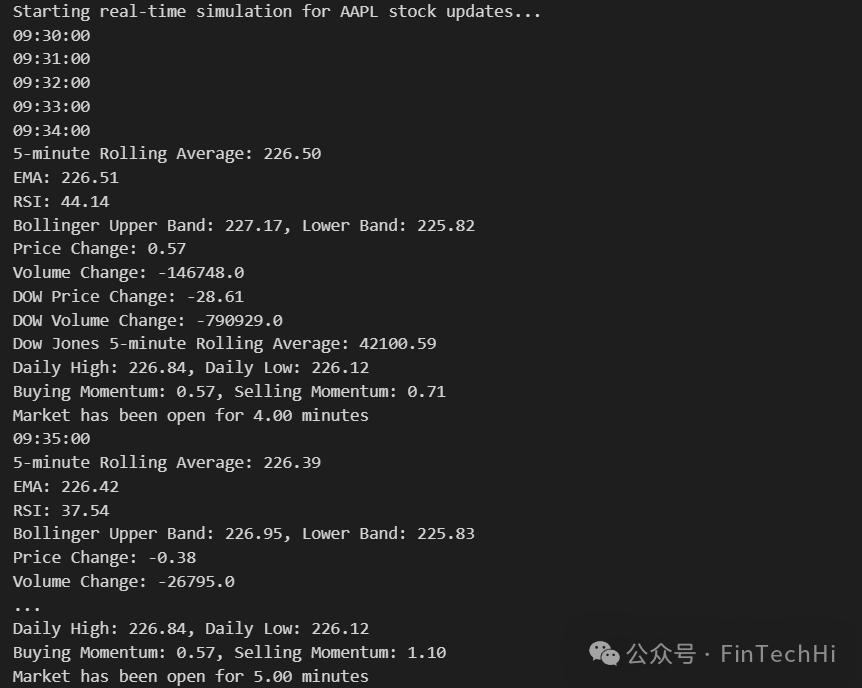
``schedule.every(10).seconds.do(process_stock_update)``# Run the scheduled jobs``print("Starting real-time simulation for AAPL stock updates...")``while True:` `schedule.run_pending()` `time.sleep(1)
运行日志:
通过Llama 3给出的数据分析:
Natural Language Insight: Apple’s price is consolidating within the Bollinger Bands, with a slight dip to 226.39. The EMA and rolling average are slightly higher, indicating a short-term uptrend.
The RSI of 37.54 suggests the stock may be oversold, potentially leading to a bounce. The buying momentum is higher than selling momentum, implying investors are still cautiously optimistic. With the Dow Jones index also experiencing a slight decline, it’s possible Apple’s strength could lead it outperforming the broader market in the short term.
使用Streamlit设计一个界面:
# Streamlit UI``st.title("AI Stock Advisor")``logtxtbox = st.empty()``logtxt = '09:30:00'``logtxtbox.caption(logtxt)``message = st.chat_message("assistant")``message.write("Starting real-time simulation for AAPL stock updates. First update will be processed in 5 minutes...")` ` ``
需要完整代码
AI大模型学习福利
作为一名热心肠的互联网老兵,我决定把宝贵的AI知识分享给大家。 至于能学习到多少就看你的学习毅力和能力了 。我已将重要的AI大模型资料包括AI大模型入门学习思维导图、精品AI大模型学习书籍手册、视频教程、实战学习等录播视频免费分享出来。

大模型&AI产品经理如何学习
求大家的点赞和收藏,我花2万买的大模型学习资料免费共享给你们,来看看有哪些东西。
1.学习路线图

第一阶段: 从大模型系统设计入手,讲解大模型的主要方法;
第二阶段: 在通过大模型提示词工程从Prompts角度入手更好发挥模型的作用;
第三阶段: 大模型平台应用开发借助阿里云PAI平台构建电商领域虚拟试衣系统;
第四阶段: 大模型知识库应用开发以LangChain框架为例,构建物流行业咨询智能问答系统;
第五阶段: 大模型微调开发借助以大健康、新零售、新媒体领域构建适合当前领域大模型;
第六阶段: 以SD多模态大模型为主,搭建了文生图小程序案例;
第七阶段: 以大模型平台应用与开发为主,通过星火大模型,文心大模型等成熟大模型构建大模型行业应用。
2.视频教程
网上虽然也有很多的学习资源,但基本上都残缺不全的,这是我自己整理的大模型视频教程,上面路线图的每一个知识点,我都有配套的视频讲解。


(都打包成一块的了,不能一一展开,总共300多集)
因篇幅有限,仅展示部分资料,需要点击下方图片前往获取
3.技术文档和电子书
这里主要整理了大模型相关PDF书籍、行业报告、文档,有几百本,都是目前行业最新的。
4.LLM面试题和面经合集
这里主要整理了行业目前最新的大模型面试题和各种大厂offer面经合集。
👉学会后的收获:👈
• 基于大模型全栈工程实现(前端、后端、产品经理、设计、数据分析等),通过这门课可获得不同能力;
• 能够利用大模型解决相关实际项目需求: 大数据时代,越来越多的企业和机构需要处理海量数据,利用大模型技术可以更好地处理这些数据,提高数据分析和决策的准确性。因此,掌握大模型应用开发技能,可以让程序员更好地应对实际项目需求;
• 基于大模型和企业数据AI应用开发,实现大模型理论、掌握GPU算力、硬件、LangChain开发框架和项目实战技能, 学会Fine-tuning垂直训练大模型(数据准备、数据蒸馏、大模型部署)一站式掌握;
• 能够完成时下热门大模型垂直领域模型训练能力,提高程序员的编码能力: 大模型应用开发需要掌握机器学习算法、深度学习框架等技术,这些技术的掌握可以提高程序员的编码能力和分析能力,让程序员更加熟练地编写高质量的代码。
1.AI大模型学习路线图
2.100套AI大模型商业化落地方案
3.100集大模型视频教程
4.200本大模型PDF书籍
5.LLM面试题合集
6.AI产品经理资源合集
👉获取方式:
😝有需要的小伙伴,可以保存图片到wx扫描二v码免费领取【保证100%免费】🆓


欢迎加入DeepSeek 技术社区。在这里,你可以找到志同道合的朋友,共同探索AI技术的奥秘。
更多推荐


 28
28 0
0- 0


 已为社区贡献139条内容

所有评论(0)