Deepseek辅助编程示例-C++到typescript画图转换
之前探索了使用Deepseek构建基于plotly.js的typescript画图项目。
https://blog.csdn.net/liliang199/article/details/157938575
这里进一步探索将C++画图代码转化为typescript基于plotly的画图代码。
具体过程为使用Deepseek将C++绘图代码转化为typescript绘图代码,并进行纠错和运行。
所用示例参考和修改自网络资料。
1 代码转换
1.1 C++画图代码
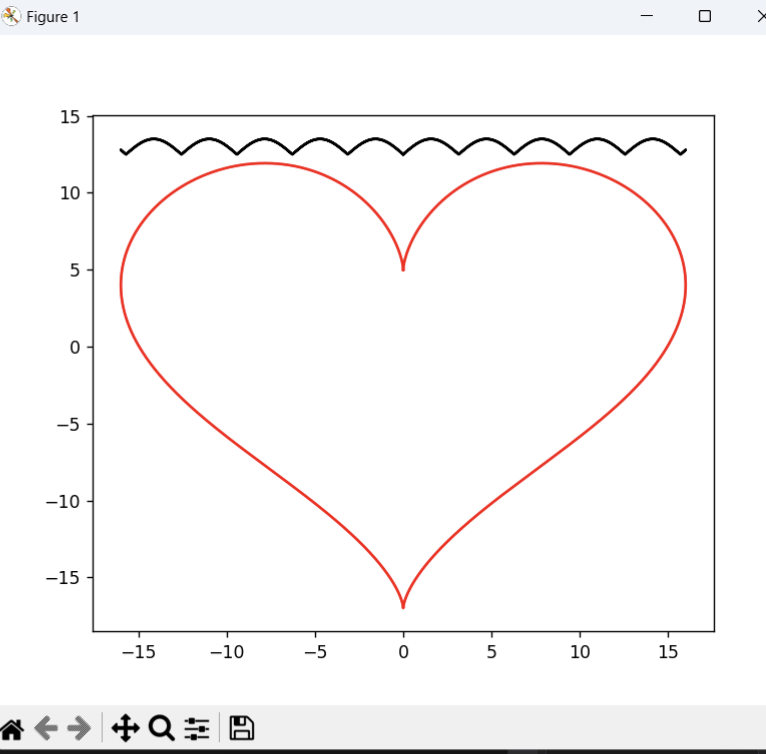
以下是一个C++画图代码,具体为使用matplotlibcpp的画图工具plt绘制心形和波浪线。
#include <cmath>
#include "matplotlibcpp.h"

namespace plt = matplotlibcpp;

#define M_PI 3.141592653589793238432643

int main()
{
    // Prepare data.
    int n = 5000; // number of data points
	std::vector<double> x(n), y(n);
    for (int i = 0; i < n; ++i)
    {
        double t = 2 * M_PI * i / n;
        x.at(i) = 16 * sin(t) * sin(t) * sin(t);
        y.at(i) = 13 * cos(t) - 5 * cos(2 * t) - 2 * cos(3 * t) - cos(4 * t);
    }

    // plot() takes an arbitrary number of (x,y,format)-triples.
    // x must be iterable (that is, anything providing begin(x) and end(x)),
    // y must either be callable (providing operator() const) or iterable.
    plt::plot(x, y, "r-", x, [](double d)
        {
            return 12.5 + abs(sin(d));
        }, "k-");

    // show plots
    plt::show();
}
以下是上述代码所绘制图像。
1.2 代码转换
我们在Deepseek中撰写提示词,将以上C++绘图代码转化为typescript绘图代码。
示例如下
请将如下c++画图代码转化为typesript代码
---
#include <cmath>
#include "matplotlibcpp.h"

namespace plt = matplotlibcpp;

#define M_PI 3.141592653589793238432643

int main()
{
    // Prepare data.
    int n = 5000; // number of data points
	std::vector<double> x(n), y(n);
    for (int i = 0; i < n; ++i)
    {
        double t = 2 * M_PI * i / n;
        x.at(i) = 16 * sin(t) * sin(t) * sin(t);
        y.at(i) = 13 * cos(t) - 5 * cos(2 * t) - 2 * cos(3 * t) - cos(4 * t);
    }

    // plot() takes an arbitrary number of (x,y,format)-triples.
    // x must be iterable (that is, anything providing begin(x) and end(x)),
    // y must either be callable (providing operator() const) or iterable.
    plt::plot(x, y, "r-", x, [](double d)
        {
            return 12.5 + abs(sin(d));
        }, "k-");

    // show plots
    plt::show();
}
Deepseek的输出如下。
由于没有制定绘图工具,Deepseek给出多种实现,包括Plotly.js、Chat.js、D3等。
以下是将 C++ 代码转换为 TypeScript 的版本,使用 Plotly.js 作为绘图库(类似于 matplotlib 的功能):
```typescript
// 安装依赖:npm install plotly.js-dist-min// 导入 Plotly
import * as Plotly from 'plotly.js-dist-min';// 常量定义
const M_PI = 3.14159265358979323846;// 准备数据
const n = 5000; // 数据点数量
const x: number[] = [];
const y: number[] = [];
const y2: number[] = [];for (let i = 0; i < n; ++i) {
const t = 2 * M_PI * i / n;
x.push(16 * Math.pow(Math.sin(t), 3));
y.push(13 * Math.cos(t) - 5 * Math.cos(2 * t) - 2 * Math.cos(3 * t) - Math.cos(4 * t));
y2.push(12.5 + Math.abs(Math.sin(x[i])));
}// 创建轨迹(类似 plot() 函数)
const trace1: Plotly.Data = {
x: x,
y: y,
mode: 'lines',
line: {
color: 'red',
width: 1
},
name: 'Heart Curve'
};const trace2: Plotly.Data = {
x: x,
y: y2,
mode: 'lines',
line: {
color: 'black',
width: 1
},
name: 'Sine Wave'
};// 配置布局
const layout: Partial<Plotly.Layout> = {
title: 'Matplotlib-style Plot in TypeScript',
xaxis: {
title: 'X Axis'
},
yaxis: {
title: 'Y Axis'
},
showlegend: true
};// 创建图形
const data = [trace1, trace2];// 渲染图形(假设有 id="plot" 的 div 元素)
Plotly.newPlot('plot', data, layout);// 或者如果要显示在独立窗口,可以使用以下方式:
// 1. 创建一个新的浏览器窗口或标签页
// 2. 或者使用 Electron 等桌面应用框架
```如果你想要一个更轻量级的解决方案,也可以使用 Chart.js:
```typescript
// 安装依赖:npm install chart.jsimport { Chart, ChartConfiguration } from 'chart.js/auto';
const M_PI = 3.14159265358979323846;
const n = 5000;
const x: number[] = [];
const y: number[] = [];
const y2: number[] = [];for (let i = 0; i < n; ++i) {
const t = 2 * M_PI * i / n;
const xVal = 16 * Math.pow(Math.sin(t), 3);
x.push(xVal);
y.push(13 * Math.cos(t) - 5 * Math.cos(2 * t) - 2 * Math.cos(3 * t) - Math.cos(4 * t));
y2.push(12.5 + Math.abs(Math.sin(xVal)));
}// 准备数据集
const datasets = [
{
label: 'Heart Curve',
data: y,
borderColor: 'red',
backgroundColor: 'transparent',
pointRadius: 0,
tension: 0.1
},
{
label: 'Sine Wave',
data: y2,
borderColor: 'black',
backgroundColor: 'transparent',
pointRadius: 0,
tension: 0.1
}
];// 配置
const config: ChartConfiguration = {
type: 'line',
data: {
labels: x,
datasets: datasets
},
options: {
responsive: true,
scales: {
x: {
title: {
display: true,
text: 'X Axis'
}
},
y: {
title: {
display: true,
text: 'Y Axis'
}
}
}
}
};// 创建图表
const ctx = document.getElementById('myChart') as HTMLCanvasElement;
new Chart(ctx, config);
```**HTML 文件示例:**
```html
<!DOCTYPE html>
<html>
<head>
<title>TypeScript Plot</title>
<!-- 对于 Plotly 版本 -->
<script src="https://cdn.plot.ly/plotly-2.24.1.min.js"></script>
</head>
<body>
<!-- Plotly 版本 -->
<div id="plot" style="width:800px; height:600px;"></div>
<!-- 或 Chart.js 版本 -->
<!-- <canvas id="myChart" width="800" height="600"></canvas> -->
<script src="dist/your-compiled-js-file.js"></script>
</body>
</html>
1.3 plotly.js示例
这里我们基于plotly.js绘制图画,所示选择plotly.js部分没,示例如下。
这里plotly.js绘图代码实现了上说C++的绘图功能,绘制心形和波浪线,分别对应trace1和trace2。
// 安装依赖:npm install plotly.js-dist-min

// 导入 Plotly
import * as Plotly from 'plotly.js-dist-min';

// 常量定义
const M_PI = 3.14159265358979323846;

// 准备数据
const n = 5000; // 数据点数量
const x: number[] = [];
const y: number[] = [];
const y2: number[] = [];

for (let i = 0; i < n; ++i) {
    const t = 2 * M_PI * i / n;
    x.push(16 * Math.pow(Math.sin(t), 3));
    y.push(13 * Math.cos(t) - 5 * Math.cos(2 * t) - 2 * Math.cos(3 * t) - Math.cos(4 * t));
    y2.push(12.5 + Math.abs(Math.sin(x[i])));
}

// 创建轨迹(类似 plot() 函数)
const trace1: Plotly.Data = {
    x: x,
    y: y,
    mode: 'lines',
    line: {
        color: 'red',
        width: 1
    },
    name: 'Heart Curve'
};

const trace2: Plotly.Data = {
    x: x,
    y: y2,
    mode: 'lines',
    line: {
        color: 'black',
        width: 1
    },
    name: 'Sine Wave'
};

// 配置布局
const layout: Partial<Plotly.Layout> = {
    title: 'Matplotlib-style Plot in TypeScript',
    xaxis: {
        title: 'X Axis'
    },
    yaxis: {
        title: 'Y Axis'
    },
    showlegend: true
};

// 创建图形
const data = [trace1, trace2];

// 渲染图形(假设有 id="plot" 的 div 元素)
Plotly.newPlot('plot', data, layout);

// 或者如果要显示在独立窗口,可以使用以下方式:
// 1. 创建一个新的浏览器窗口或标签页
// 2. 或者使用 Electron 等桌面应用框架
2 代码运行
2.1 代码修复
Deepseek转化后的typescript代码,由于一些客观原因,可能存在于法错误。
这里主要为trace1和trace2的数据与plotly.js的输入参数不匹配。
我们基于VSCode错误信息提示,修改trace1和trace2的格式,主要为:
1)trace1和trace2增加Plotly.Data约束
2)画图标签参数调整为chart适配验证环境要求
import * as Plotly from 'plotly.js-dist-min';


// 常量定义
const M_PI = 3.14159265358979323846;
// 准备数据
const n = 5000; // 数据点数量
const x: number[] = [];
const y: number[] = [];
const y2: number[] = [];

for (let i = 0; i < n; ++i) {
    const t = 2 * M_PI * i / n;
    x.push(16 * Math.pow(Math.sin(t), 3));
    y.push(13 * Math.cos(t) - 5 * Math.cos(2 * t) - 2 * Math.cos(3 * t) - Math.cos(4 * t));
    y2.push(12.5 + Math.abs(Math.sin(x[i])));
}
// 创建轨迹(类似 plot() 函数)
const trace1: Plotly.Data = {
    x: x,
    y: y,
    mode: 'lines',
    line: {
        color: 'red',
        width: 10
    },
    name: 'Heart Curve'
};
const trace2: Plotly.Data = {
    x: x,
    y: y2,
    mode: 'lines',
    line: {
        color: 'black',
        width: 10
    },
    name: 'Sine Wave'
};
// 配置布局
const layout: Partial<Plotly.Layout> = {
    title: 'Matplotlib-style Plot in TypeScript',
    xaxis: {
        title: 'X Axis'
    },
    yaxis: {
        title: 'Y Axis'
    },
    showlegend: true
};
// 创建图形
const data = [trace1, trace2];
Plotly.newPlot('chart', data, layout);
当然,我们也可请Deepseek帮助fix这些错误。
2.2 运行绘图
在typescript环境,参考之前探索构建绘图环境,运行上述绘图代码。
代码输出如下所示
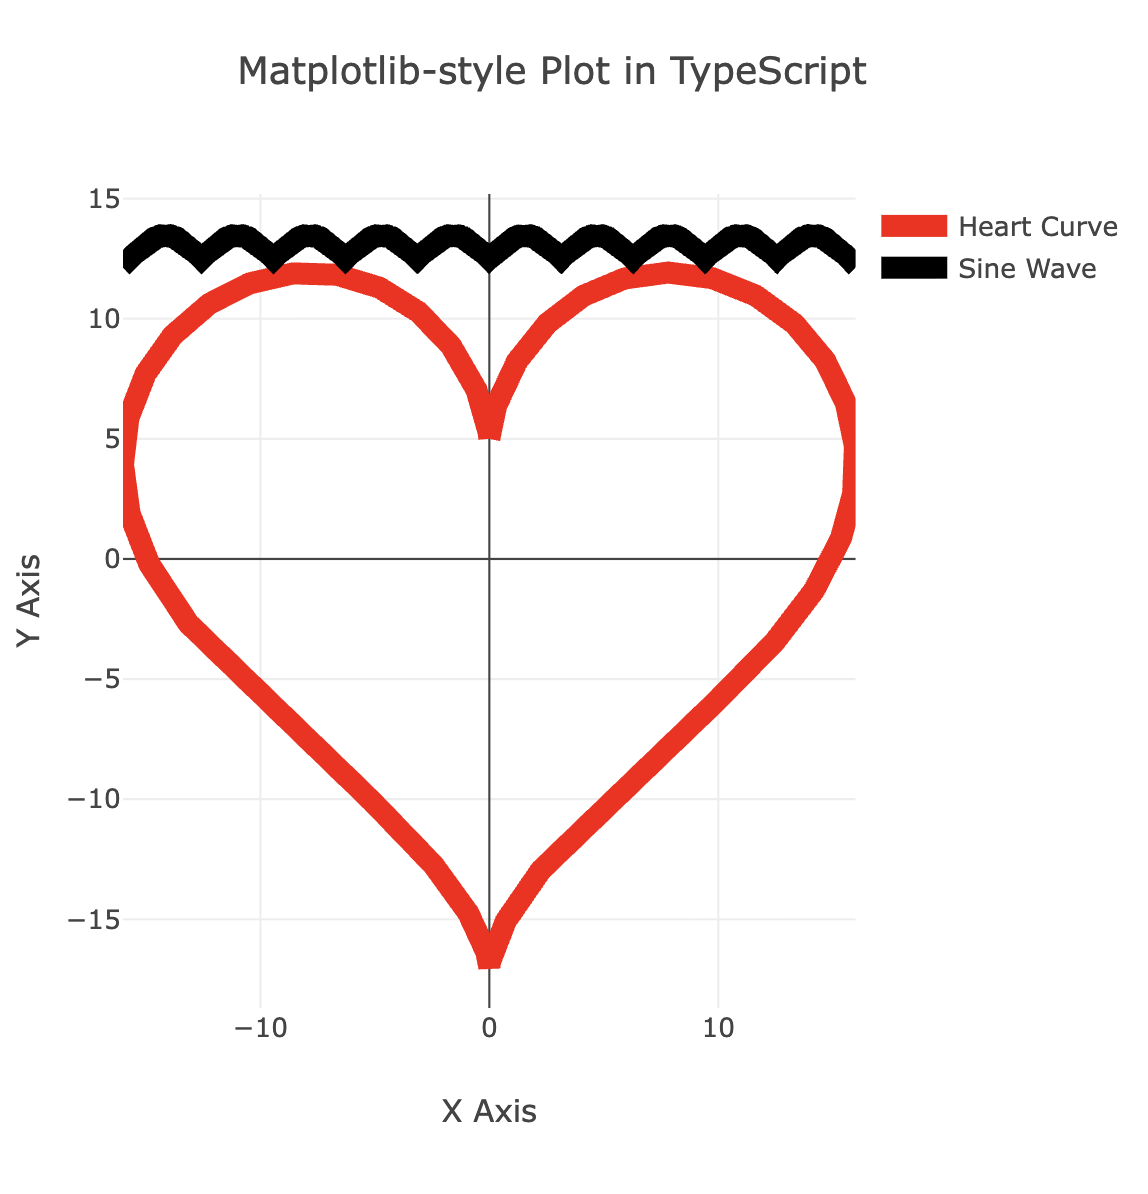
虽然缩放原因导致两个图有差异,参考坐标系,其实两个图是一样的。
这说明以上Deepseek转化后获得的plotly.js画图代码完整实现了C++绘图代码的功能。
reference
---
如何在C++中优雅地绘制图表
https://blog.csdn.net/m0_50910915/article/details/147124338
Plotly.js
https://www.w3schools.com/js/js_graphics_plotly.asp
Deepseek辅助编程示例-在typescript中基于plotly.js画图

欢迎加入DeepSeek 技术社区。在这里,你可以找到志同道合的朋友,共同探索AI技术的奥秘。
更多推荐

 13
13 0
0- 0


 已为社区贡献5条内容

所有评论(0)