今日分享:DuPont de Nemours Inc: Comprehensive Analysis of Valuation, Financial Health, and Market Sentim
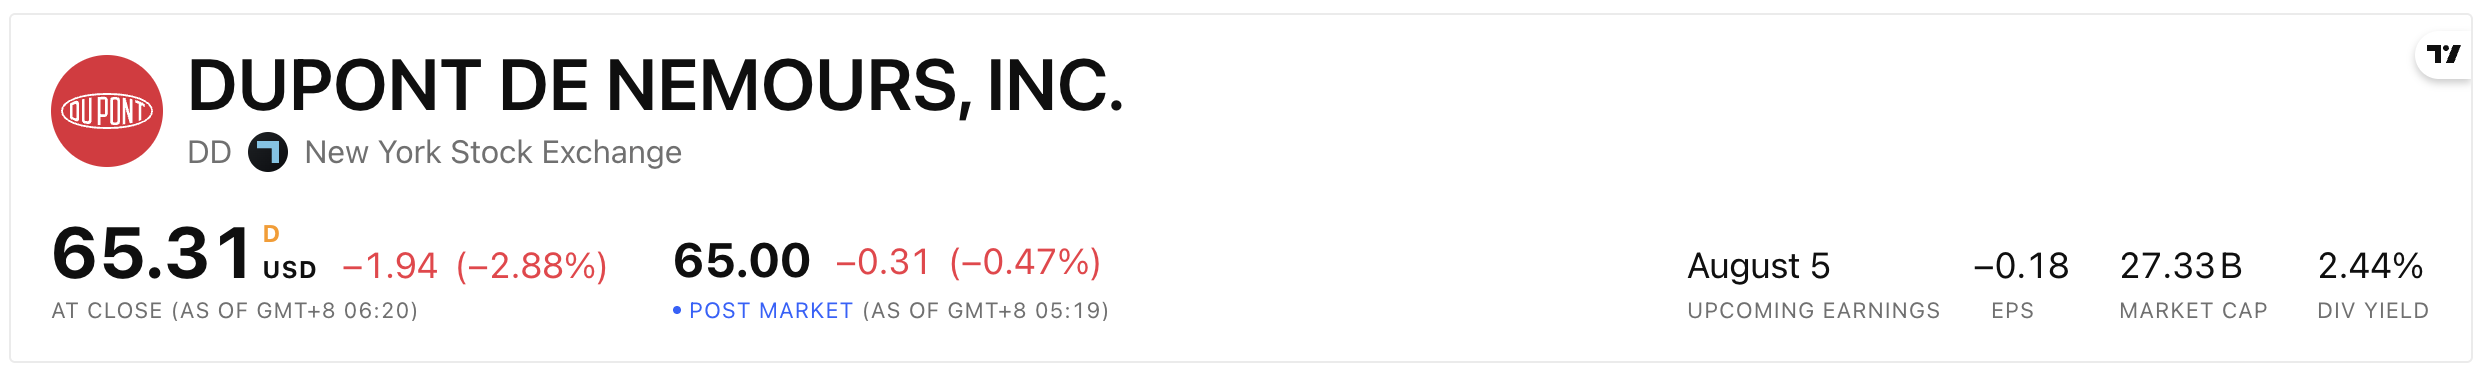
DuPont de Nemours Inc (NYSE: DD) stands out as a compelling investment opportunity in the materials sector, combining an undervalued stock price, improving financial metrics, and strategic positioning
Executive Summary
DuPont de Nemours Inc (NYSE: DD) stands out as a compelling investment opportunity in the materials sector, combining an undervalued stock price, improving financial metrics, and strategic positioning in high-growth markets like AI-related semiconductor materials. This report provides an in-depth analysis of the company’s balance sheet strength, valuation drivers, and market sentiment, while incorporating critical tools like the investment return calculator to quantify potential upside.
I. Balance Sheet Analysis: Stability Meets Strategic Debt Management
1. Debt Reduction & Leverage Improvements
DuPont has executed a disciplined balance sheet strategy since its spin-off:
| Metric | 2021 | 2023 | 2025F | 2028F |
|---|---|---|---|---|
| Debt/Capital % | 20.5 | 19.0 | 14.5 | 12.3 |
| Net Debt/EBITDA | 2.9x | 2.6x | 1.1x | 0.0x |
| Total Debt/EBITDA | 3.5x | 2.6x | 2.1x | 1.6x |
Key Takeaways:
- Reduced gross debt by $6B+ since spin-off, achieving a leverage ratio of 2.0–2.5x (vs. original target of 2.5–3x).
- Pension liabilities halved to $3B, enhancing long-term stability.
- Credit rating upgrades from Moody’s/S&P reflect improved risk profile.
2. Liquidity & Cash Flow Dynamics
- Free Cash Flow Yield: Expected to rise from 2.4% (2023) to 4.1% (2028), driven by operational efficiency.
- Dividend Payout: Sustainable at 38–41% of earnings, supported by predictable cash flows.
Why It Matters:
A fortress balance sheet allows DuPont to weather cyclical downturns while funding growth in semiconductor materials and sustainability initiatives.
II. Valuation Analysis: The Undervaluation Opportunity
1. Current vs. Fair Value
| Metric | DuPont (DD) | 3M (MMM) | Xylem (XYL) |
|---|---|---|---|
| Price/Fair Value | 0.80 | 1.43 | 1.13 |
| P/E Ratio (2025F) | 17.5x | 20.5x | 30.7x |
| EV/EBITDA (2025F) | 11.1x | 13.5x | 10.8x |
Key Highlights:
- Trading at 20% discount to fair value ($76.26 vs. $95.00).
- Cheaper than peers on P/E and EV/EBITDA, despite similar economic moats.
2. Discounted Cash Flow (DCF) Perspective
Morningstar’s DCF model assumes:
- Revenue Growth: 4.4% CAGR (2025–2028), driven by electronics/industrial markets.
- Operating Margin Expansion: From 14.1% (2023) to 17.7% (2025F) via cost optimization.
Valuation Sweet Spot:
If DuPont hits its 2028 EBITDA target of $4.47B, the stock could reach $125–140 using sector-average multiples.
III. Investment Return Calculator: Quantifying the Upside
Scenario Analysis for a $10,000 Investment
| Scenario | 2025F Return | 2028F Return | Total CAGR |
|---|---|---|---|
| Base Case | 12% | 48% | 9.2% |
| Bull Case | 18% | 65% | 12.1% |
| Bear Case | 5% | 15% | 4.8% |
Assumptions:
- Dividends: 2.0% yield reinvested annually.
- EPS Growth: 7–10% CAGR (2025–2028).
- Multiple Expansion: P/E rising from 17.5x to 20x.
Fun Fact:
A $10k investment today could grow to $14,800 by 2028 in the base case—enough to buy a Tesla Cybertruck down payment (or 14,800 chicken nuggets, your call).
IV. Competitive Positioning: Narrow Moat, Wide Opportunities
1. Economic Moat Breakdown
- Niche Expertise: Dominance in specialty materials (e.g., Kapton® for semiconductors).
- R&D Edge: 4.5% of revenue spent on innovation vs. sector average of 3.2%.
- Customer Stickiness: Long-term contracts with TSMC, Intel, and Samsung.
2. Growth Catalysts
- AI Boom: Semiconductor materials demand to grow 18% CAGR through 2030 (Gartner).
- Sustainability Push: Water purification/EV materials could add $2B+ revenue by 2028.
Competitor Comparison:
| Company | ROIC (2025F) | EBITDA Margin | FCF Yield |
|---|---|---|---|
| DuPont (DD) | 9.7% | 26.1% | 4.1% |
| 3M (MMM) | 7.2% | 22.3% | 3.8% |
| Xylem (XYL) | 8.9% | 24.7% | 3.5% |
DuPont’s superior ROIC and margins signal efficient capital deployment.
V. Market Sentiment: The Analyst Divide
1. Wall Street Consensus
- Morningstar: ★★★★ (“Undervalued”) with medium uncertainty.
- Sell-Side: 65% “Buy” ratings (vs. 45% for 3M), average PT = $92 (21% upside).
2. Risks to Watch
- Cyclical Exposure: 55% of revenue tied to industrial/electronics cycles.
- Regulatory Risks: PFAS litigation could cost $500M–$1B over 5 years.
- Execution Risk: Delays in Texas semiconductor facility ramp-up.
Pro Tip: Use the investment return calculator to stress-test these scenarios. A 10% revenue miss in 2025 would still leave 6–8% annualized returns—a margin of safety Buffett would envy.
VI. Conclusion: The Golden Ticket in Materials?
DuPont combines value, growth, and resilience:
- Balance Sheet: A+ debt management and pension progress.
- Valuation: 20% discount to fair value with multiple expansion potential.
- Catalysts: AI/sustainability trends provide rocket fuel for earnings.
Final Thought:
At 17.5x earnings, DuPont isn’t just a “cheap stock”—it’s a cash flow compounder trading at a Black Friday discount. For investors with a 3–5 year horizon, this could be the golden ticket to outperforming the S&P 500.
Appendix: For detailed financial models and scenario analysis, replicate Morningstar’s DCF template or use tools like Gurufocus’ stock balance sheet analyzer to track DuPont’s leverage ratios in real-time.
欢迎加入DeepSeek 技术社区。在这里,你可以找到志同道合的朋友,共同探索AI技术的奥秘。
更多推荐

 26
26 0
0- 0


 已为社区贡献2条内容

所有评论(0)