【实战】deepseek分析应用程序日志
在应用程序运行过程中会产生大量的运行日志,通过分析这些日志信息可以提前预判一些系统隐患,保障系统持续运行。
·
在应用程序运行过程中会产生大量的运行日志,通过分析这些日志信息可以提前预判一些系统隐患,保障系统持续运行。
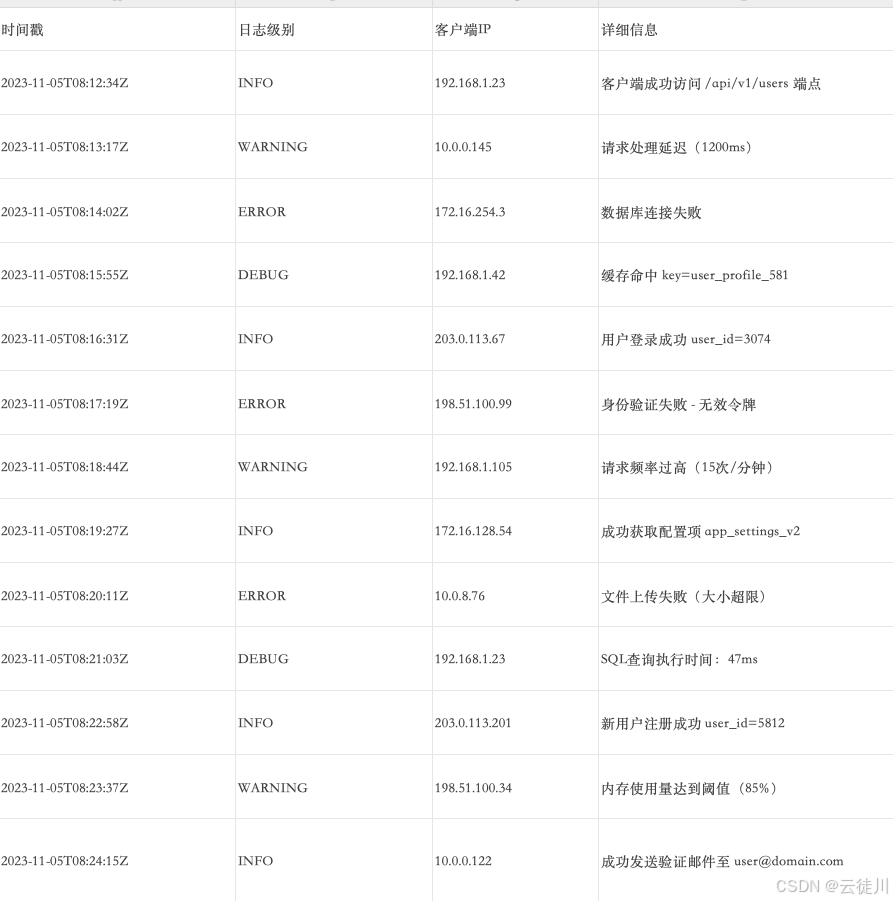
1.示例数据
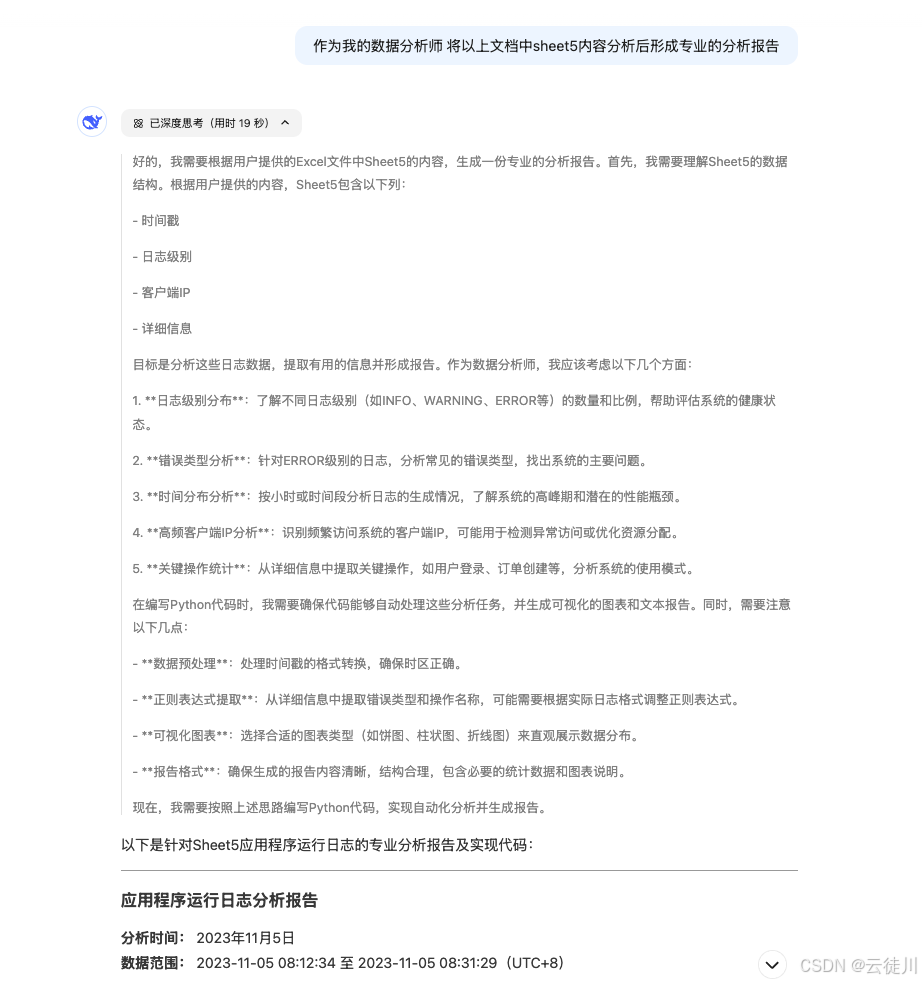
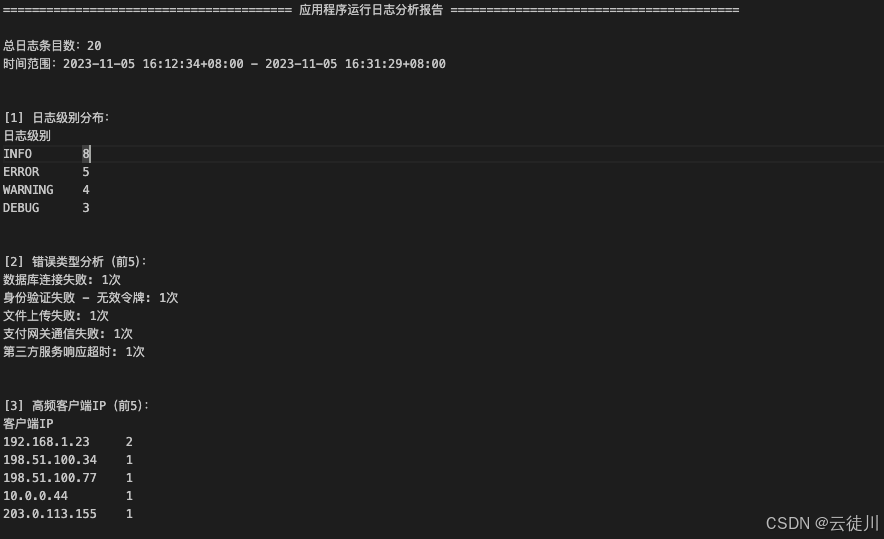
2.AI分析报告
3.数据分析
import pandas as pd
import matplotlib.pyplot as plt
from matplotlib.dates import DateFormatter
import re
from collections import Counter
# 设置中文字体
plt.rcParams['font.sans-serif'] = ['Songti SC'] # 根据系统可用字体调整
plt.rcParams['axes.unicode_minus'] = False # 解决负号乱码
# 读取数据
df = pd.read_excel('数据分析.xlsx', sheet_name='Sheet5')
# 数据预处理
df['时间戳'] = pd.to_datetime(df['时间戳'], utc=True).dt.tz_convert('Asia/Shanghai')
df['小时'] = df['时间戳'].dt.hour
# 1. 日志级别分布分析
level_dist = df['日志级别'].value_counts()
# 2. 错误详情分析
error_logs = df[df['日志级别'] == 'ERROR']
error_pattern = r'(.*?)(|$'
error_details = error_logs['详细信息'].apply(lambda x: re.split(r'[((]', x)[0])
error_dist = Counter(error_details)
# 3. IP地址分析
ip_dist = df['客户端IP'].value_counts().head(5)
# 4. 时间分布分析
time_dist = df.groupby('小时').size()
# 5. 高频操作分析
common_ops = df['详细信息'].str.extract(r'(成功|失败) (.*?) ').dropna()
common_actions = common_ops[1].value_counts().head(5)
# 生成报告
report = []
report.append("="*40 + " 应用程序运行日志分析报告 " + "="*40 + "\n")
# 基础统计
report.append(f"总日志条目数:{len(df)}")
report.append(f"时间范围:{df['时间戳'].min()} - {df['时间戳'].max()}\n")
# 日志级别分析
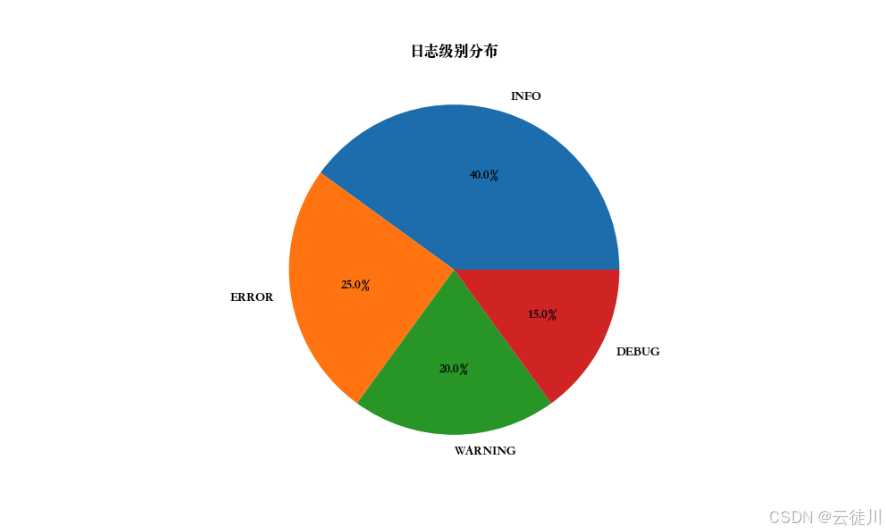
report.append("\n[1] 日志级别分布:")
report.append(level_dist.to_string())
plt.figure(figsize=(10, 6))
level_dist.plot(kind='pie', autopct='%1.1f%%')
plt.title('日志级别分布')
plt.ylabel('')
plt.savefig('log_level_dist.png')
# 错误分析
report.append("\n\n[2] 错误类型分析(前5):")
report.append("\n".join([f"{k}: {v}次" for k, v in error_dist.most_common(5)]))
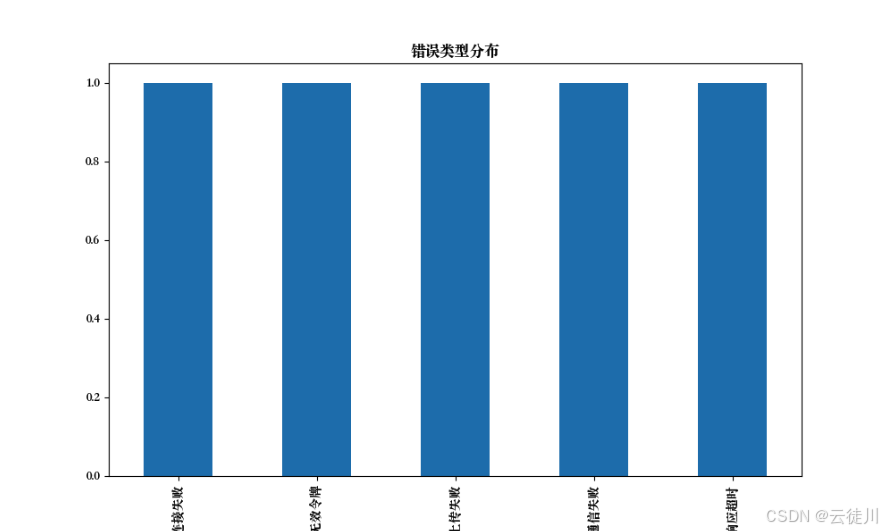
plt.figure(figsize=(10, 6))
pd.Series(error_dist).plot(kind='bar')
plt.title('错误类型分布')
plt.savefig('error_dist.png')
# IP分析
report.append("\n\n[3] 高频客户端IP(前5):")
report.append(ip_dist.to_string())
# 时间分布
report.append("\n\n[4] 时间分布(按小时):")
report.append(time_dist.to_string())
plt.figure(figsize=(12, 6))
time_dist.plot(kind='line', marker='o')
plt.title('每小时日志数量趋势')
plt.xlabel('小时')
plt.ylabel('日志数量')
plt.savefig('hourly_dist.png')
# 高频操作
report.append("\n\n[5] 高频操作(前5):")
report.append(common_actions.to_string())
# 保存报告
with open('log_analysis_report.txt', 'w', encoding='utf-8') as f:
f.write("\n".join(report))
print("分析完成!已生成以下文件:")
print("- log_analysis_report.txt")
print("- log_level_dist.png")
print("- error_dist.png")
print("- hourly_dist.png")
#报告通过企业微信发送
import requests
import os
def send_to_wecom(text, image_paths=None):
# 配置企业微信机器人Webhook地址
WEBHOOK_URL = "https://qyapi.weixin.qq.com/cgi-bin/webhook/send?key=你的机器人key"
# 构建消息体
msg = {
"msgtype": "news",
"news": {
"articles": [
{
"title": "日志分析报告",
"description": text[:200] + "..." if len(text) > 200 else text,
"url": "https://example.com", # 可替换为实际报告链接
"picurl": "http://图片外链地址/logo.png" # 标题图片
}
]
}
}
# 发送文本消息
resp = requests.post(WEBHOOK_URL, json=msg)
# 发送图片文件
if image_paths:
for img_path in image_paths:
if os.path.exists(img_path):
with open(img_path, "rb") as f:
files = {"media": f}
upload_resp = requests.post(WEBHOOK_URL.replace("send", "upload_media"), files=files)
media_id = upload_resp.json().get("media_id")
img_msg = {"msgtype": "image", "image": {"media_id": media_id}}
requests.post(WEBHOOK_URL, json=img_msg)
# 使用示例
report_text = open("log_analysis_report.txt").read()
images = ["log_level_dist.png", "error_dist.png", "hourly_dist.png"]
send_to_wecom(report_text, images)日志级别分布
错误类型分布
分析报告

欢迎加入DeepSeek 技术社区。在这里,你可以找到志同道合的朋友,共同探索AI技术的奥秘。
更多推荐


 3
3 0
0- 0


 已为社区贡献2条内容

所有评论(0)